Simple Interest Calculator: Easy Tool for Loan and Savings Calculations
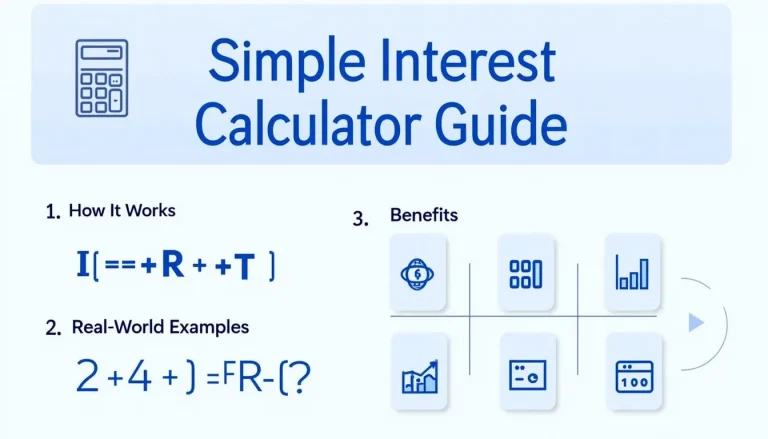
The calculator multiplies your principal by the annual rate and the time in years; $$I = P rac R{100} times T$$. Add that interest to the principal for the total. A $8,750 loan at 3.75 % for 2.5 years costs $820.31 interest—11 % of the principal (Investopedia, https://www.investopedia.com/terms/s/simple_interest.asp).