Receivables Turnover Ratio Calculator
Is this tool helpful?
How to use the tool
- Enter Sales Revenue. Example 1: $900,000. Example 2: $2,250,000.
- Enter Average Accounts Receivable. Example 1: $100,000. Example 2: $500,000.
- Press “Calculate”. Your receivables turnover ratio appears instantly.
- Read the result. Higher ratios mean faster collection and stronger liquidity.
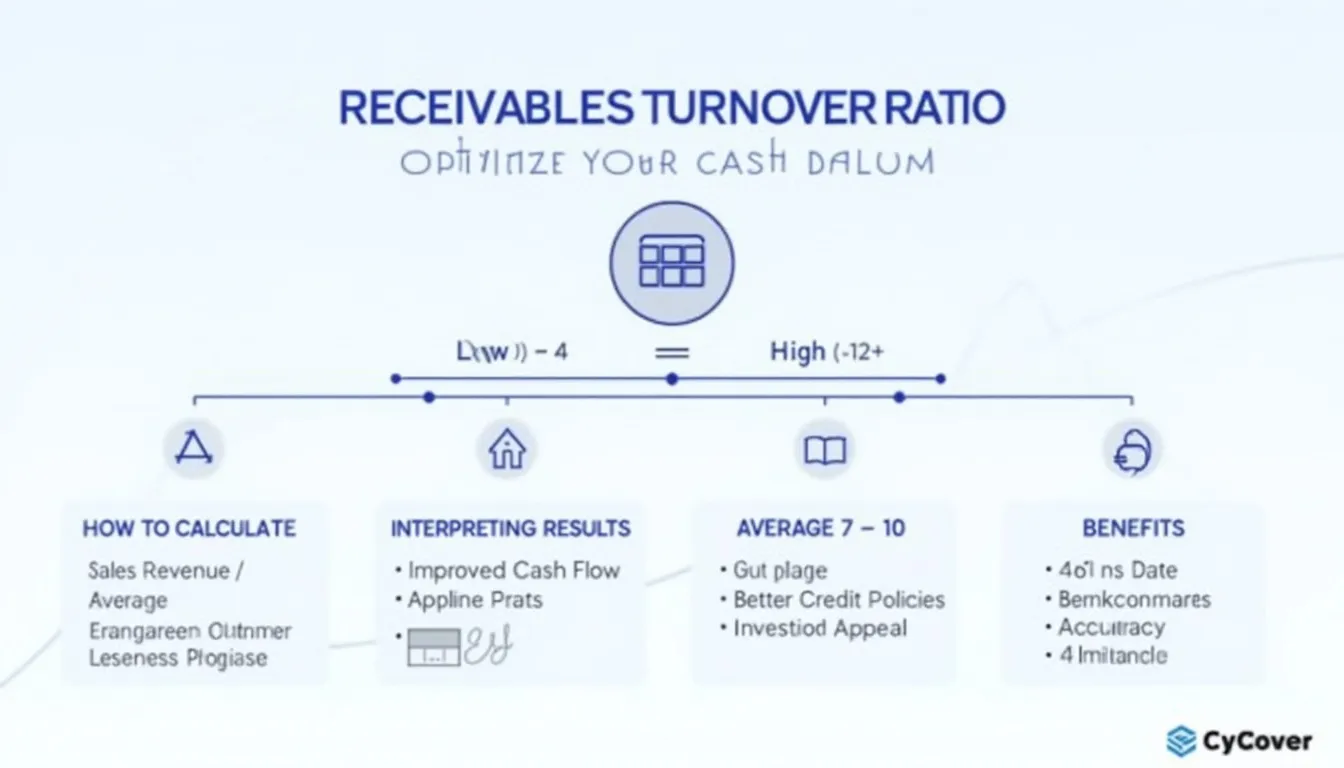
Formula used
$$\text{Receivables Turnover Ratio}= rac{\text{Sales Revenue}}{\text{Average Accounts Receivable}}$$
Example calculations
- Example 1: $$ rac{900{,}000}{100{,}000}=9.0$$ — you collect receivables nine times per year.
- Example 2: $$ rac{2{,}250{,}000}{500{,}000}=4.5$$ — collections cycle about every 81 days (365 ÷ 4.5).
Quick-Facts
- Healthy manufacturing ratio: 6-10 turns per year (Investopedia, https://www.investopedia.com/terms/r/receivableturnoverratio.asp).
- Average Collection Period = 365 ÷ turnover (Corporate Finance Institute, https://corporatefinanceinstitute.com).
- Formula uses net credit sales under GAAP ASC 606 (FASB, 2014).
- Ratios below 5 flag credit-control risk (Deloitte 2023 Working Capital Survey).
FAQ
What is the receivables turnover ratio?
The ratio shows how many times you convert credit sales into cash during a period, reflecting collection efficiency (Investopedia, https://www.investopedia.com/terms/r/receivableturnoverratio.asp).
How does the calculator work?
It divides your sales revenue by average accounts receivable, then rounds the result to two decimals for quick comparison.
Which inputs are required?
You only need total period sales revenue and the average of opening and closing receivable balances (FASB, 2014).
What is a good turnover ratio?
Manufacturing businesses aim for 6-10; retail often exceeds 12 due to faster cash cycles (Investopedia, https://www.investopedia.com/terms/r/receivableturnoverratio.asp).
How can I improve a low ratio?
Shorten payment terms, invoice promptly, and enforce credit checks; Deloitte found stricter terms raise turnover by 15 % (Deloitte 2023 Working Capital Survey).
How do I convert the ratio into days?
Divide 365 by your ratio to estimate average collection days—e.g., 365 ÷ 9 = 41 days (Corporate Finance Institute, https://corporatefinanceinstitute.com).
Does industry affect benchmarks?
Yes; utilities average 5-7 while groceries exceed 20 due to daily cash sales (Moody’s Sector Medians 2022).
Can seasonal firms rely on an annual ratio?
Create monthly or quarterly ratios to spot seasonal spikes; the SEC recommends interim analysis for accuracy (SEC Staff Accounting Bulletin 104).
Important Disclaimer
The calculations, results, and content provided by our tools are not guaranteed to be accurate, complete, or reliable. Users are responsible for verifying and interpreting the results. Our content and tools may contain errors, biases, or inconsistencies. Do not enter personal data, sensitive information, or personally identifiable information in our web forms or tools. Such data entry violates our terms of service and may result in unauthorized disclosure to third parties. We reserve the right to save inputs and outputs from our tools for the purposes of error debugging, bias identification, and performance improvement. External companies providing AI models used in our tools may also save and process data in accordance with their own policies. By using our tools, you consent to this data collection and processing. We reserve the right to limit the usage of our tools based on current usability factors.