Inflation Adjusted Return Calculator: Measure Real Investment Performance
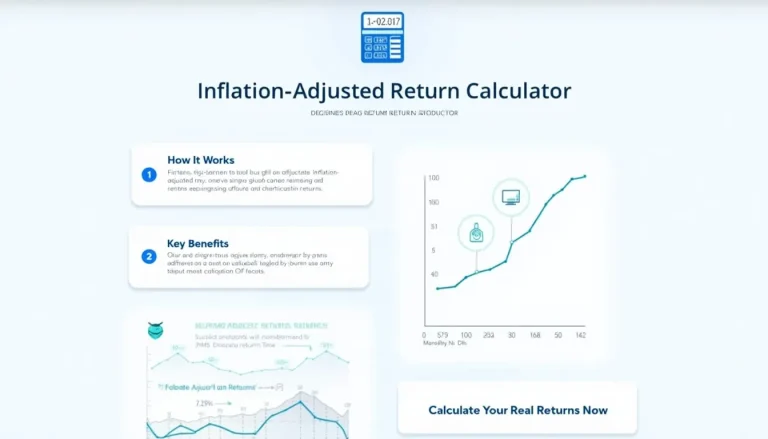
Our calculator converts a stock’s price change, dividends and CPI data into real returns, showing true purchasing-power growth. U.S. equities delivered an average 6.8 % real annual return from 1926-2022 (Ibbotson SBBI Yearbook, 2023).