Two Asset Portfolio Calculator
Is this tool helpful?
How to Use the Two Asset Portfolio Variance Calculator Effectively
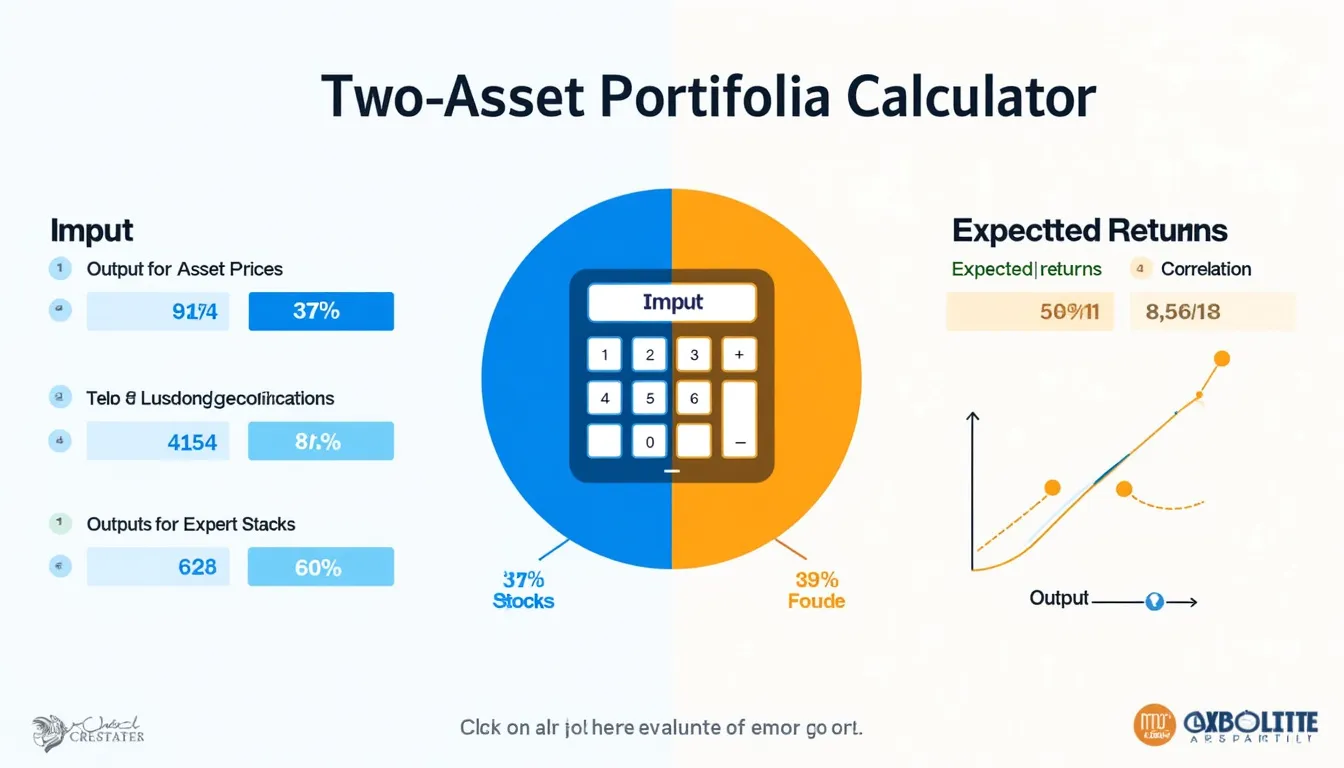
Our intuitive Two Asset Portfolio Variance Calculator helps you evaluate and optimize your investment strategy by analyzing the risk and return of a two-asset portfolio. To get the most accurate insights, follow these simple steps with sample inputs:
- Enter the Price of Asset A and Asset B ($): Provide the current market prices of your assets. Example: Asset A price = $75.00, Asset B price = $125.00
- Input the Expected Returns of Both Assets (%): Add the projected returns as percentages for each asset. Example: Asset A return = 8.5%, Asset B return = 5.2%
- Provide the Standard Deviations of Each Asset: Enter the standard deviation values that represent the volatility of each asset. Example: Asset A standard deviation = 0.15, Asset B standard deviation = 0.10
- Specify the Correlation Coefficient Between the Assets: Input the correlation value, which ranges from -1 (perfect negative correlation) to 1 (perfect positive correlation). Example: Correlation = 0.3
- Calculate and Analyze: Click “Calculate” to view your portfolio’s expected return and variance, helping you understand potential performance and risk.
Using these inputs, the calculator helps you explore how different combinations affect your portfolio’s risk-return profile, enabling better-informed investment decisions.
What Is the Two Asset Portfolio Variance Calculator? Purpose and Benefits
The Two Asset Portfolio Variance Calculator is an essential investment tool designed to assist investors in optimizing their portfolio by analyzing the relationship between expected returns, risk (volatility), and correlation of two financial assets. This calculator facilitates:
- Enhanced Portfolio Optimization: Balance multiple assets to achieve desired risk-return objectives.
- Risk Management: Quantify portfolio volatility through variance, helping to manage uncertainty.
- Diversification Analysis: Understand how the correlation between assets influences overall portfolio risk.
- Performance Projection: Estimate realistic returns based on weighted asset allocations.
- Scenario Planning: Quickly model various market conditions and asset combinations.
By utilizing this calculator, investors gain clarity on how their investments interplay, helping them build resilient, balanced portfolios tailored to their individual risk tolerance and financial goals.
Example Calculation Using the Two Asset Portfolio Variance Calculator
Let’s walk through an example to demonstrate how the calculator processes inputs and generates valuable insights about your investment portfolio.
Step 1: Input Values
- Price of Asset A: $80
- Price of Asset B: $120
- Expected Return of Asset A: 7%
- Expected Return of Asset B: 9%
- Standard Deviation of Asset A: 0.18
- Standard Deviation of Asset B: 0.25
- Correlation between Assets: 0.4
Step 2: Calculate Asset Weights
Weights are calculated based on asset prices:
$$ W_A = \frac{80}{80 + 120} = 0.40 $$$$ W_B = \frac{120}{80 + 120} = 0.60 $$Step 3: Determine Expected Portfolio Return
Calculate the weighted average of individual asset returns:
$$ E(R_p) = (0.40 \times 0.07) + (0.60 \times 0.09) = 0.082 = 8.20\% $$Step 4: Calculate Portfolio Variance
Use the formula incorporating weights, standard deviations, and correlation:
$$ \sigma_p^2 = (0.40)^2 \times (0.18)^2 + (0.60)^2 \times (0.25)^2 + 2 \times 0.40 \times 0.60 \times 0.4 \times 0.18 \times 0.25 = 0.0383 $$Interpretation:
- Expected Return: 8.20% indicates the average projected annual return based on the portfolio composition.
- Portfolio Variance: 0.0383 represents the portfolio’s risk or volatility, helping you assess potential fluctuations.
This example illustrates how combining assets with different returns, volatilities, and correlations can shape your portfolio’s overall risk-return profile.
Understanding the Mathematics Behind the Two Asset Portfolio Variance Calculator
To leverage this tool effectively, it’s helpful to understand the key mathematical concepts driving its calculations:
1. Asset Weights
The weights determine the proportion of each asset in the portfolio:
$$ W_A = \frac{P_A}{P_A + P_B} $$$$ W_B = \frac{P_B}{P_A + P_B} $$2. Expected Portfolio Return
The portfolio’s expected return is the weighted average of its assets’ returns:
$$ E(R_p) = W_A \cdot R_A + W_B \cdot R_B $$3. Portfolio Variance
Portfolio variance quantifies how the combined assets contribute to overall risk:
$$ \sigma_p^2 = W_A^2 \cdot \sigma_A^2 + W_B^2 \cdot \sigma_B^2 + 2 \cdot W_A \cdot W_B \cdot \rho_{AB} \cdot \sigma_A \cdot \sigma_B $$Where:
- WA, WB: Asset weights
- RA, RB: Expected returns
- σA, σB: Standard deviations (volatility)
- ρAB: Correlation coefficient between the two assets
Advantages of Using the Two Asset Portfolio Variance Calculator for Investment Planning
Incorporating this calculator into your investment toolkit offers valuable benefits that help optimize portfolio performance and risk management:
1. Improved Asset Allocation Decisions
By visualizing how different asset mixes impact returns and risk, you can identify optimal allocations aligned with your financial goals.
2. Clear Risk Measurement
Quantifying portfolio variance gives you an objective measure of volatility, enabling better risk control strategies.
3. Enhanced Diversification Insights
Understanding asset correlation allows you to construct portfolios that minimize unsystematic risk and smooth out returns.
4. Practical Scenario Testing
Easily adjust input parameters to model various market scenarios and assess their impact on your portfolio’s risk and return.
5. Educational Value
Gain hands-on experience with foundational investment principles such as diversification, risk-return tradeoffs, and asset allocation.
Real-Life Applications: How Investors Can Benefit from This Calculator
The Two Asset Portfolio Variance Calculator is adaptable for various investment contexts, including:
- Balancing Equity and Fixed Income: Assessing risk-return profiles between stocks and bonds for conservative portfolios.
- Comparing Sector Investments: Evaluating combinations of high-growth tech stocks and stable utility stocks.
- International Diversification: Exploring cross-border asset allocations to mitigate country-specific risks.
- Scenario Analysis for Market Volatility: Adapting strategies during volatile market phases by simulating different asset correlations.
This versatile tool empowers investors, financial advisors, and wealth managers to make more confident, data-driven decisions tailored to evolving market conditions.
Important Disclaimer
The calculations, results, and content provided by our tools are not guaranteed to be accurate, complete, or reliable. Users are responsible for verifying and interpreting the results. Our content and tools may contain errors, biases, or inconsistencies. We reserve the right to save inputs and outputs from our tools for the purposes of error debugging, bias identification, and performance improvement. External companies providing AI models used in our tools may also save and process data in accordance with their own policies. By using our tools, you consent to this data collection and processing. We reserve the right to limit the usage of our tools based on current usability factors. By using our tools, you acknowledge that you have read, understood, and agreed to this disclaimer. You accept the inherent risks and limitations associated with the use of our tools and services.