IPO Underpricing Analyzer
Is this tool helpful?
How to Use the IPO Underpricing Analyzer Effectively
Follow these clear steps to calculate the underpricing of an IPO using this tool:
- Enter the IPO Offer Price: Provide the initial offering price set by the company. For example, if the company sets its IPO price at $30.75 per share, input this value.
- Enter the First-Day Closing Price: Input the stock’s closing price at the end of its first trading day. For instance, if the closing price is $38.20, fill in this amount.
- Click “Calculate Underpricing”: This will generate the first-day return percentage, show you how it compares to the industry average benchmark, and provide insights on the pricing efficiency.
What Is the IPO Underpricing Analyzer and Why Use It?
The IPO Underpricing Analyzer is a straightforward tool designed to help you understand how much an IPO’s initial stock price differs from its first-day closing price. IPO underpricing measures the percentage increase between these two prices, signaling how much potential return early investors might see.
This tool helps by instantly calculating the underpricing percentage and comparing it to an industry average benchmark of 14.0%. Using this, you can quickly assess if an IPO is priced efficiently and how it performs against typical market expectations.
You’ll find this analyzer valuable whether you are an investor evaluating new offerings, a financial analyst monitoring market trends, or a company preparing to price an IPO.
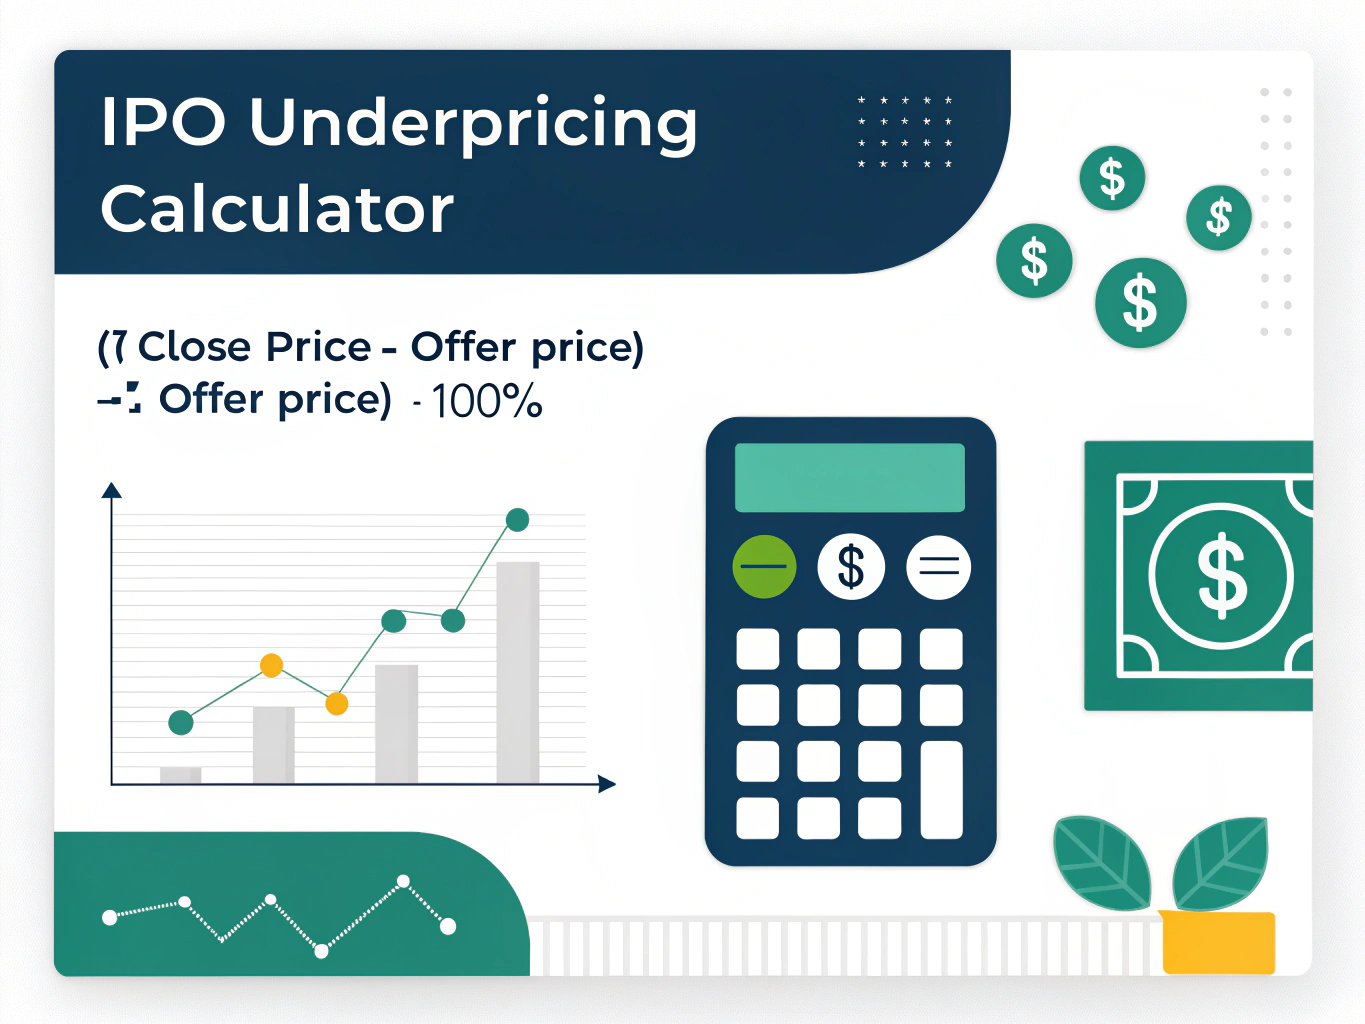
Understanding IPO Underpricing: The Formula
IPO underpricing quantifies the gain between the first-day closing price and the original offer price. The formula is:
$$\text{Underpricing} = \frac{\text{Close Price} – \text{Offer Price}}{\text{Offer Price}} \times 100\%$$
This percentage tells you how much the stock price rose on the first trading day relative to its offer price.
Example Calculations Using the IPO Underpricing Analyzer
Example 1: Consumer Goods IPO
- Offer Price: $22.40
- First-Day Close Price: $28.70
Calculation:
$$\frac{28.70 – 22.40}{22.40} \times 100\% = 28.13\%$$
This 28.13% underpricing shows that the IPO generated a strong first-day return above the industry average, indicating high market demand and potential underpricing.
Example 2: Energy Sector IPO
- Offer Price: $45.00
- First-Day Close Price: $48.60
Calculation:
$$\frac{48.60 – 45.00}{45.00} \times 100\% = 8.00\%$$
This 8.00% underpricing is slightly below the industry benchmark of 14.0%, suggesting more conservative pricing or a moderate market reaction.
Key Benefits of Using the IPO Underpricing Analyzer
- Instant first-day return calculation without manual math errors
- Comparison against recognized industry benchmarks to gauge pricing effectiveness
- Quick insight into IPO market performance supporting your investment decisions
- Identifying pricing trends and market sentiment with real-time feedback
Who Can Benefit from This IPO Underpricing Calculator?
- Individual investors looking for profitable IPO trading opportunities
- Portfolio managers assessing IPO allocations for diversified holdings
- Underwriters and investment bankers analyzing pricing strategies and market feedback
- Financial analysts and researchers studying IPO performance and sector trends
Strategic Implications of IPO Underpricing
For Companies Going Public
- Optimize IPO pricing to balance capital raised and demand
- Minimize money left on the table by reducing excessive underpricing
- Evaluate underwriter effectiveness and market conditions
For Investors
- Identify IPOs with potential strong first-day returns
- Compare IPO pricing performance across different industries
- Develop strategies based on IPO market trends and sentiment
Industry Benchmarking and Market Insights
Industry benchmarks, currently set at 14.0%, provide crucial context. This allows you to:
- Compare IPO underpricing against typical market averages
- Spot unusually high or low underpricing cases
- Understand sector-specific pricing patterns
- Gauge overall market sentiment and economic cycles
Maximizing Your Analysis: Best Practices
- Compare underpricing results across IPOs within the same sector for better insights
- Account for prevailing market conditions during the IPO period
- Analyze trends using multiple IPO data points over time
- Incorporate macroeconomic factors to understand broader impacts
Common Questions About IPO Underpricing Analysis
What range should I expect for typical IPO underpricing?
Underpricing usually ranges between 10% and 20% but varies by industry and market conditions.
How does IPO underpricing affect investors and companies?
Investors benefit from potential immediate gains, while companies aim for successful offerings and market credibility through appropriate pricing.
When is it best to use this IPO underpricing calculator?
Use it when evaluating current IPOs, planning investment strategies, or conducting market research with historical IPO data.
Do underpricing levels differ by industry?
Yes. Technology and biotech sectors often show higher underpricing compared to more stable industries like utilities or consumer goods.
What role do underwriters play in IPO pricing?
Underwriters set the offer price based on market demand, company fundamentals, and investor interest, using a book-building process.
Advanced Considerations for Deep IPO Underpricing Analysis
- Monitor market volatility and timing effects
- Evaluate sector-specific underpricing patterns
- Consider company size, age, and reputation
- Assess overall market sentiment during the IPO
- Compare with comparable company performance histories
Supporting Your Decision-Making Process
- Develop entry and exit strategies for IPO participation
- Make informed portfolio allocation decisions
- Time the market using first-day return insights
- Manage investment risk related to IPO volatility
Important Disclaimer
The calculations, results, and content provided by our tools are not guaranteed to be accurate, complete, or reliable. Users are responsible for verifying and interpreting the results. Our content and tools may contain errors, biases, or inconsistencies. Do not enter personal data, sensitive information, or personally identifiable information in our web forms or tools. Such data entry violates our terms of service and may result in unauthorized disclosure to third parties. We reserve the right to save inputs and outputs from our tools for the purposes of error debugging, bias identification, and performance improvement. External companies providing AI models used in our tools may also save and process data in accordance with their own policies. By using our tools, you consent to this data collection and processing. We reserve the right to limit the usage of our tools based on current usability factors.