Is this tool helpful?
How to Use the 50-Day SMA Calculator Effectively
To get the most out of this 50-Day Simple Moving Average (SMA) calculator for your stock trading strategy, follow these easy steps:
- Current Stock Price (USD): Input the latest closing price of the stock you want to analyze. For example, enter 52.75 for a mid-cap stock or 240.10 for a blue-chip stock like IBM.
- Historical Prices (USD): Enter exactly 50 recent closing prices, separated by commas, starting with the most recent first. For instance, if analyzing a healthcare stock, you might use: 58.20, 57.95, 58.10, … for the last 50 trading days.
After filling in these values, click “Calculate SMA” to generate your moving average and get actionable trading signals.
What Is the 50-Day Simple Moving Average Calculator and Why Use It?
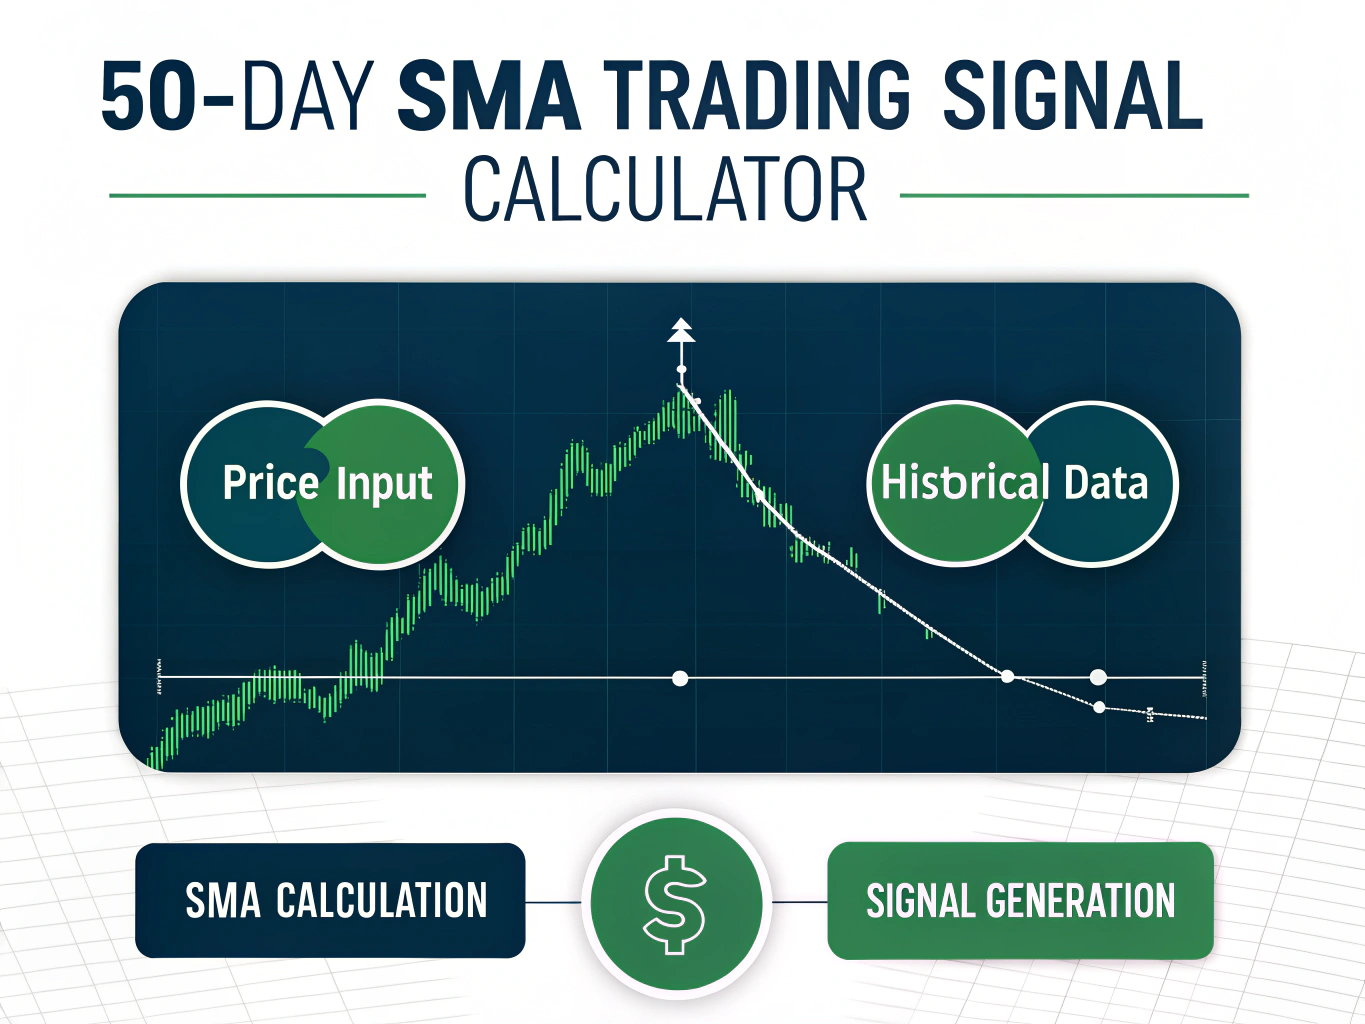
This 50-Day SMA calculator is a practical tool designed for traders and investors to quickly compute the simple moving average of a stock’s price over the last 50 days. The SMA smooths out daily price fluctuations and highlights the underlying trend, helping you identify potential buying or selling opportunities.
By comparing the current stock price with the 50-day SMA, you gain insight into price momentum and market sentiment, empowering you to make more informed trading decisions without manual calculations.
Benefits of Using the 50-Day SMA Technical Indicator
- Simplifies trend detection: Reveals whether the stock is in an upward or downward trend by analyzing average prices.
- Generates clear buy/sell signals: Helps you spot entry and exit points based on the price crossing the moving average.
- Improves trading speed: Automates complex calculations so you can react faster in volatile markets.
- Reduces emotions: Lets you base decisions on objective data rather than market noise.
Example Calculation Using the JavaScript SMA Calculator
Suppose you analyze a technology stock with the following prices:
- Current Price: $125.50
- Previous 50-day closing prices: values ranging from $120.00 to $130.25
The calculator sums the current price plus the previous 49 prices, then divides the total by 50 to get the SMA:
$$ \text{50-Day SMA} = \frac{\text{Sum of the last 50 closing prices}}{50} $$If the SMA calculates to $123.40, and since the current price ($125.50) is above the SMA, the tool signals a Buy opportunity, indicating an upward trend.
Key Features and Functionality of This Moving Average Analysis Tool
- Interactive price chart: Visualize daily closing prices alongside the constant 50-day SMA for trend comparison.
- Automatic signals: Receive immediate buy or sell indicators based on price movement relative to the SMA.
- Easy-to-read results: Clear presentation of the calculated SMA value and trading signal.
- Supports any stock symbol: Enter relevant price data for your stocks of interest.
Real-World Applications for Stock Traders and Investors
Scenario 1: Confirming an Uptrend
- Stock: Facebook (META)
- Current Price: $180.75
- 50-Day SMA: $175.30
- Interpretation: Since the current price is above the SMA, the tool confirms a bullish trend and suggests considering a buy position.
Scenario 2: Detecting a Potential Downtrend
- Stock: Coca-Cola (KO)
- Current Price: $55.10
- 50-Day SMA: $57.45
- Interpretation: The price falling below the SMA signals a possible downward trend, suggesting caution or selling.
Advanced Moving Average Strategies for Enhanced Trading
Multiple Timeframe Analysis
Combine the 50-day SMA with other moving averages like the 20-day SMA for short-term trends and the 200-day SMA for long-term trend confirmation. This layered approach refines trade timing and reduces false signals.
Using the Golden Cross Strategy
Watch for when the 50-day SMA crosses above the 200-day SMA—a “Golden Cross”—which often indicates a strong bullish trend and potential buy signal.
Frequently Asked Questions About the 50-Day SMA Calculator
What is a Simple Moving Average (SMA)?
A Simple Moving Average calculates the average stock closing price over a set number of days, smoothing out short-term volatility to reveal underlying trends.
Why choose a 50-day period for SMA?
The 50-day SMA balances sensitivity and stability. It filters daily noise while offering timely signals for medium-term trend analysis.
How do I interpret the buy or sell signals?
When the current price rises above the 50-day SMA, it triggers a buy signal indicating upward momentum. Conversely, when the price drops below the SMA, it triggers a sell signal reflecting potential downward movement.
Can I use this tool for any stock?
Yes. This calculator works for any publicly traded stock, provided you have the current and historical closing prices.
How frequently should I check the SMA?
If you’re an active trader, daily checks are recommended. For longer-term investors, weekly or monthly reviews suffice.
Should I rely solely on the SMA for trading decisions?
Use the SMA in combination with other indicators and fundamental analysis for a well-rounded trading strategy.
Best Practices for Using the 50-Day SMA Calculator
- Confirm SMA signals with volume trends and other technical indicators.
- Consider overall market conditions and economic news.
- Watch for support and resistance levels near the SMA.
- Keep a trading journal to track decisions and results.
- Use the SMA as one part of a comprehensive trading plan.
Important Disclaimer
The calculations, results, and content provided by our tools are not guaranteed to be accurate, complete, or reliable. Users are responsible for verifying and interpreting the results. Our content and tools may contain errors, biases, or inconsistencies. We reserve the right to save inputs and outputs from our tools for the purposes of error debugging, bias identification, and performance improvement. External companies providing AI models used in our tools may also save and process data in accordance with their own policies. By using our tools, you consent to this data collection and processing. We reserve the right to limit the usage of our tools based on current usability factors. By using our tools, you acknowledge that you have read, understood, and agreed to this disclaimer. You accept the inherent risks and limitations associated with the use of our tools and services.


