Price to Cash Flows Ratio Calculator
Is this tool helpful?
How to use the tool
- Step 1 – Market Cap: Type the company’s total equity value. Example A: $500 000 000. Example B: $1 200 000 000.
- Step 2 – Cash Flows from Operations: Enter the latest annual figure. Example A: $25 000 000. Example B: $80 000 000.
- Step 3 – Hit “Calculate” to display the Price-to-Cash-Flows (P/CF) ratio.
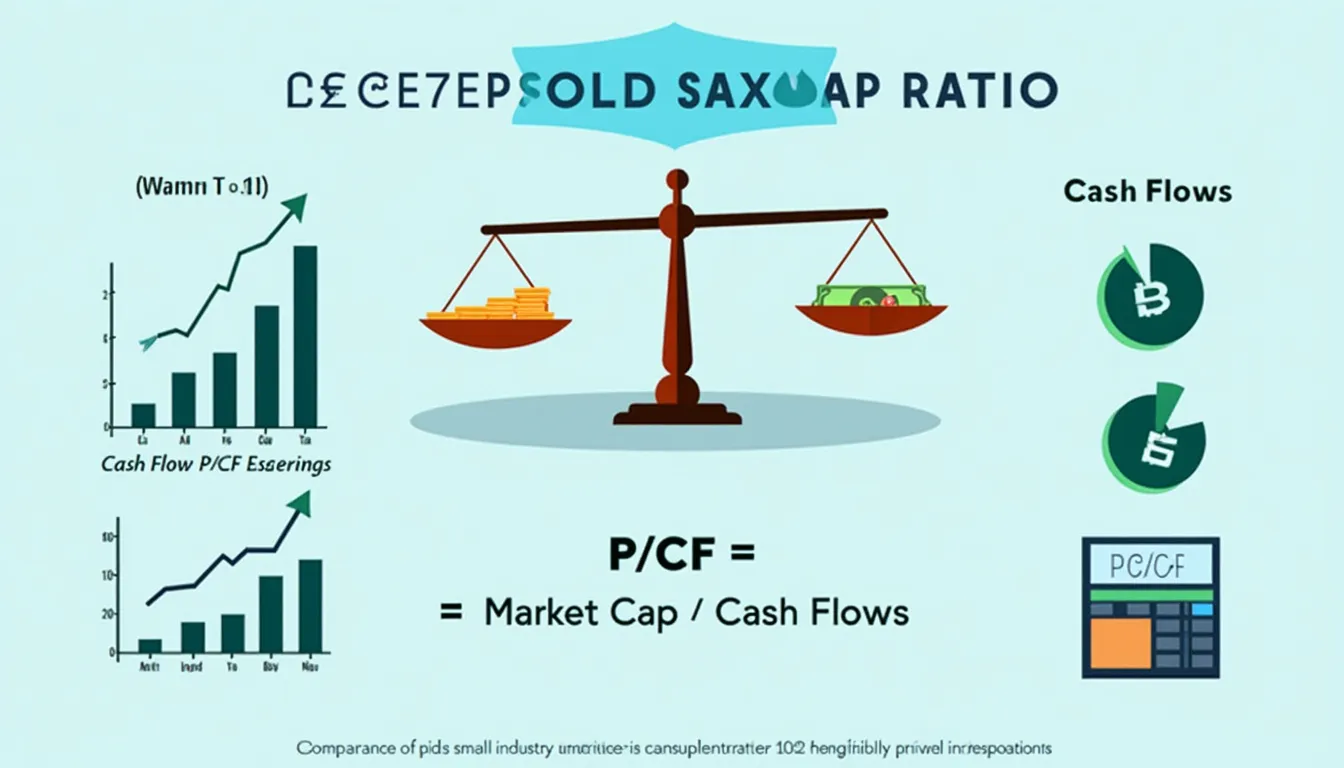
Formula used
$$ rac{\text{Market Capitalization}}{\text{Cash Flows from Operations}} $$
Example calculation A
- $500 000 000 ÷ $25 000 000 = 20.0
Example calculation B
- $1 200 000 000 ÷ $80 000 000 = 15.0
Quick-Facts
- The median P/CF for the S&P 500 was 17.5 in 2023 (FactSet, 2023).
- Utilities averaged 9-12, while tech averaged 20-25 in 2022 (Morningstar Sector Report, 2022).
- Cash flow figures come from the statement of cash flows, SEC Form 10-K (SEC, 2020).
- P/CF below 10 may signal undervaluation, according to CFA curriculum (CFA Institute, 2021).
- Negative operating cash flow yields a non-meaningful ratio (Investopedia, P/CF Ratio).
FAQ
What is the Price-to-Cash-Flows ratio?
The P/CF ratio compares a company’s market value with the cash it generates from operations, highlighting how much you pay for each dollar of cash flow (Investopedia, P/CF Ratio).
Why prefer P/CF over P/E?
Cash flow is less affected by non-cash accounting entries, so P/CF exposes earnings manipulation that can distort P/E (Mulford & Comiskey “Creative Cash Flow Reporting”, 2005).
What counts as an attractive P/CF?
Analysts call ratios under 15 attractive relative to the S&P 500 median of 17.5 (FactSet, 2023); always benchmark against the sector average (Morningstar, 2022).
Can the ratio be negative?
Yes. Negative operating cash flow produces a negative or undefined P/CF, signalling liquidity stress (SEC Staff Accounting Bulletin 104, 2020).
How often should I recalculate it?
Update the ratio each quarter when the company files Form 10-Q; long-term investors can review annually with the 10-K (SEC, 2020).
How does industry affect interpretation?
Asset-heavy sectors like utilities run P/CF near 10, whereas high-growth tech averages above 20 (Morningstar Sector Report, 2022).
What are the main limitations?
P/CF ignores capital spending and leverage; combine it with free-cash-flow yield and debt ratios for a fuller view (CFA Institute, 2021).
How does P/CF differ from Price-to-Free-Cash-Flow?
Free cash flow subtracts capital expenditures, giving a stricter measure of surplus cash; therefore P/FCF is typically higher than P/CF (“McKinsey Valuation”, 2020).
Important Disclaimer
The calculations, results, and content provided by our tools are not guaranteed to be accurate, complete, or reliable. Users are responsible for verifying and interpreting the results. Our content and tools may contain errors, biases, or inconsistencies. Do not enter personal data, sensitive information, or personally identifiable information in our web forms or tools. Such data entry violates our terms of service and may result in unauthorized disclosure to third parties. We reserve the right to save inputs and outputs from our tools for the purposes of error debugging, bias identification, and performance improvement. External companies providing AI models used in our tools may also save and process data in accordance with their own policies. By using our tools, you consent to this data collection and processing. We reserve the right to limit the usage of our tools based on current usability factors.