LBO Analysis Calculator
Is this tool helpful?
How to Use the LBO Analysis Calculator Effectively
This Leveraged Buyout (LBO) analysis calculator helps you quickly estimate investment returns on debt-financed acquisitions. To get accurate results, enter realistic values in each input field below. Here are two sample scenarios with different inputs to guide you:
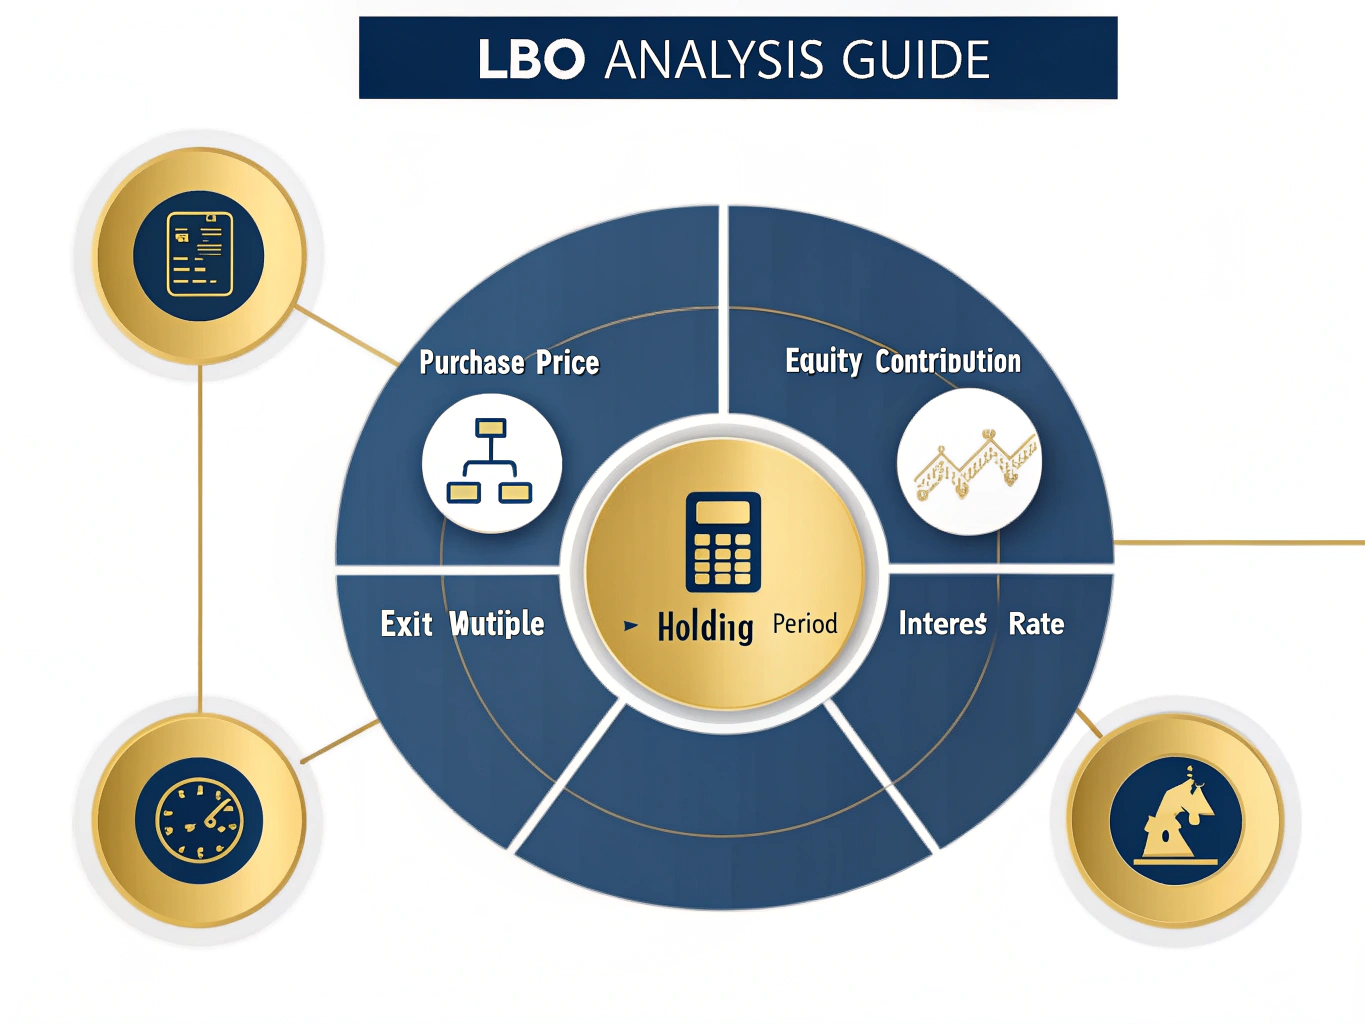
Input Fields Explained
- Purchase Price ($): Enter the total acquisition cost of the target company. For instance, a $15,000,000 purchase price for a regional logistics firm, or $60,000,000 for a retail distribution business.
- Equity Contribution ($): Input the equity portion of the purchase price you’ll invest. Examples include $4,500,000 (30%) for the logistics firm or $12,000,000 (20%) for the retail business.
- Exit Multiple: Specify the expected sale multiple of the original purchase price. Typical values range from 1.8 to 4.0, depending on growth prospects and industry norms.
- Holding Period (Years): Select how long you plan to hold the investment before exit, usually between 3 and 7 years.
- Interest Rate (%): Enter the annual interest rate applied to debt financing. Typical market rates fall between 5% and 12%, depending on credit conditions.
What Is the LBO Analysis Calculator and Why Use It?
An LBO analysis calculator measures the potential financial returns of a leveraged buyout — an acquisition funded primarily with borrowed money plus a smaller equity contribution. If you’re a private equity investor, financial analyst, or corporate development professional, this tool helps you estimate key metrics like IRR (Internal Rate of Return), equity multiple, and total return based on your input assumptions.
Using this calculator, you assess how different financing structures, holding periods, and exit valuations affect investment performance. It simplifies complex calculations behind leverage effects and time value of money to support faster, data-driven decisions.
Example Calculations Using the LBO Calculator
Let’s walk through a sample investment scenario to see how the calculator works:
- Purchase Price: $20,000,000
- Equity Contribution: $6,000,000
- Exit Multiple: 3.0x
- Holding Period: 5 years
- Interest Rate: 7.0%
The calculator subtracts equity from purchase price to find debt amount. It then calculates annual interest payments and projected exit value based on the exit multiple applied to the purchase price. By factoring in interest costs and cash flows over the holding period, it computes the Internal Rate of Return (IRR), equity multiple, and total return.
Mathematical Foundation
The core of the calculator’s logic uses the Internal Rate of Return (IRR), which solves this equation:
$$ \sum_{t=0}^{n} \frac{CF_t}{(1 + r)^t} = 0 $$Where:
- CF_t = cash flow at time period t
- r = internal rate of return
- n = total holding period in years
Key Benefits of Using the LBO Analysis Calculator
- Fast and Reliable Calculations: Get instant IRR and equity multiple results without manual formulas.
- Flexible Scenario Testing: Adjust purchase price, leverage, interest rates, and holding periods to model different outcomes.
- Improved Investment Decisions: Assess how leverage and exit assumptions impact returns and risks.
- Better Capital Structure Planning: Understand how varying equity and debt portions affect cash flow requirements and profitability.
- Efficient Exit Timing Analysis: Compare returns across holding periods to identify optimal exit windows.
Real-World Use Cases and Sample Scenarios
Case 1: Consumer Goods Company Acquisition
- Purchase Price: $35 million
- Equity Contribution: $10.5 million
- Exit Multiple: 2.6x
- Holding Period: 6 years
- Interest Rate: 6.5%
Case 2: Healthcare Services Investment
- Purchase Price: $80 million
- Equity Contribution: $24 million
- Exit Multiple: 3.2x
- Holding Period: 4 years
- Interest Rate: 8%
Frequently Asked Questions About Leveraged Buyout Analysis
What does the exit multiple represent?
The exit multiple indicates how many times the original purchase price the business is expected to sell for. For example, a 3.0x multiple means the sale price is three times the purchase price.
How does the holding period impact returns?
Longer holding periods allow operational improvements and value growth but may decrease the IRR due to the time value of money. The ideal holding period varies by industry and investment goals.
What is considered a good IRR for an LBO investment?
Private equity firms often target IRRs between 20% and 25%, but this depends on risk, industry, and market conditions.
How do changes in interest rate affect returns?
Higher interest rates raise debt servicing costs, lowering cash flow available to equity holders. Even a 1% increase can significantly reduce overall returns in highly leveraged deals.
Advanced Considerations in Leveraged Buyout Analysis
Industry and Market Factors
- Cyclical Industries: Use lower leverage to reduce risk during downturns.
- High-Growth Sectors: Support higher exit multiples due to growth potential.
- Asset-Heavy Industries: Can sustain higher debt levels backed by tangible assets.
- Market Timing: Debt availability, prevailing multiples, and economic outlook affect LBO feasibility and returns.
Perform Sensitivity and Risk Analyses
Explore various scenarios by adjusting:
- Exit multiples within expected ranges
- Interest rates across market conditions
- Holding periods to optimize timing
- Operating assumptions affecting cash flow
Also consider market risks, operating leverage, financial leverage, and exit environment challenges in your overall assessment.
Important Disclaimer
The calculations, results, and content provided by our tools are not guaranteed to be accurate, complete, or reliable. Users are responsible for verifying and interpreting the results. Our content and tools may contain errors, biases, or inconsistencies. Do not enter personal data, sensitive information, or personally identifiable information in our web forms or tools. Such data entry violates our terms of service and may result in unauthorized disclosure to third parties. We reserve the right to save inputs and outputs from our tools for the purposes of error debugging, bias identification, and performance improvement. External companies providing AI models used in our tools may also save and process data in accordance with their own policies. By using our tools, you consent to this data collection and processing. We reserve the right to limit the usage of our tools based on current usability factors.