Meeting Setup
Give your meeting a name for easy identification
Select the currency for cost calculations
Choose how to calculate participant costs
Factor to account for benefits, taxes, and office costs (e.g., 1.35 for 35% overhead)
Expected duration in HH:MM format to track overspend
Participant Information
Total number of people attending the meeting
Choose whether to enter hourly or annual compensation
Average compensation per participant (hourly rate or annual salary)
Starting meeting...
Is this tool helpful?
How to Use the Meeting Cost Calculator
Start by setting up your meeting parameters in the Meeting Setup section. Enter a descriptive meeting title like “Product Strategy Review” or “Monthly Sales Update” to help identify your session later. Select your preferred currency from the dropdown menu – choose from USD, EUR, GBP, CAD, or AUD based on your organization’s financial reporting needs.
Choose your calculation mode based on your team structure. For teams with similar compensation levels, select “Simple Mode” and enter the number of participants (for example, 8 team members) along with their average rate. If you know hourly rates, enter something like $85 per hour. For annual salaries, switch the rate type and enter values like $110,000.
For diverse teams with varying compensation, switch to “Individual Rates” mode. Add each participant separately – perhaps “Senior Developer” at $95/hour and “Project Manager” at $75/hour. You can mix rate types, entering some as hourly rates and others as annual salaries.
Set the overhead multiplier to account for benefits, taxes, and office costs. Most organizations use values between 1.3 and 1.5 – enter 1.4 to add 40% overhead to base compensation costs. If you have a planned meeting duration, enter it in HH:MM format like “01:15” for a 75-minute session to track potential overspend.
Click “Start Meeting” to begin the cost tracking. The calculator validates your inputs and displays the real-time cost counter, elapsed time, and cost accumulation chart. Use the pause button during breaks to stop cost accumulation temporarily, then resume when the meeting continues. Stop the meeting when finished and download a summary report for expense tracking and meeting efficiency analysis.
Understanding Meeting Cost Tracking
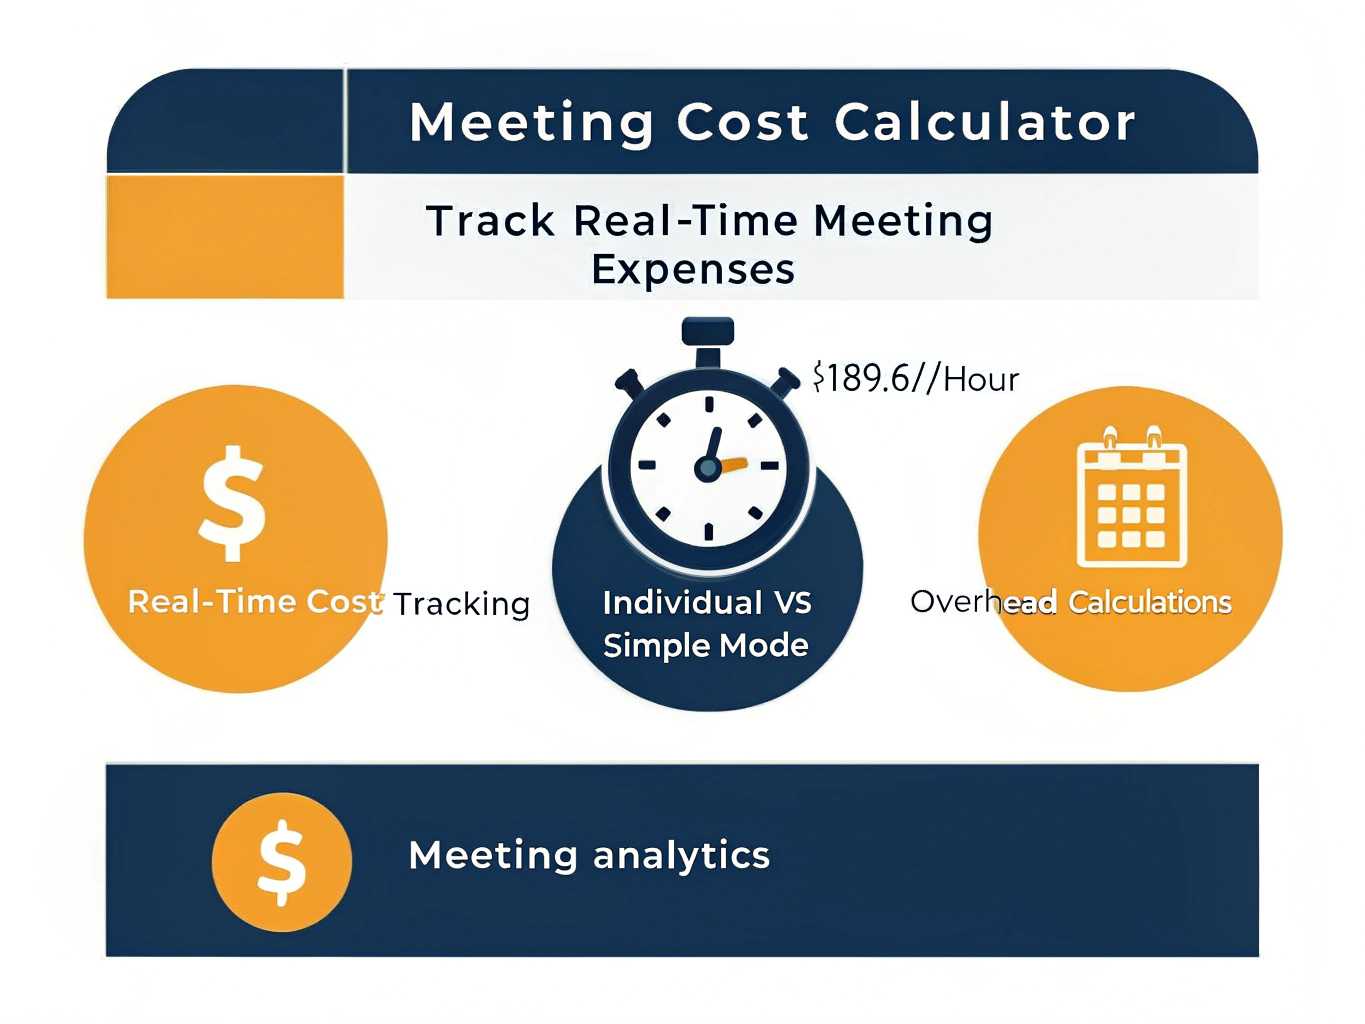
The meeting cost calculator transforms abstract salary information into real-time financial awareness during business meetings. This powerful tool calculates the true cost of meetings by combining participant salaries, overhead expenses, and time tracking to display exactly how much money your organization spends each second people sit in conference rooms.
You benefit from immediate cost visibility that drives meeting efficiency and accountability. Instead of scheduling hour-long meetings by default, you’ll make informed decisions about meeting duration when you see the financial impact displayed in real-time. The calculator helps justify meeting expenses, optimize team time allocation, and demonstrate the value of efficient communication practices.
Organizations use meeting cost tracking to reduce unnecessary meetings, shorten existing ones, and ensure the right people attend each session. The visual cost counter creates awareness that leads to more focused discussions and better meeting outcomes.
Real-Time Cost Calculation Methods
The calculator uses precise mathematical formulas to convert salary information into per-second cost rates. The system calculates total hourly burn rates by summing all participant compensation, then divides by 3600 to determine the cost per second.
For annual salary conversion, the tool applies the standard formula:
$$\text{Hourly Rate} = \frac{\text{Annual Salary}}{52 \times 40}$$The real-time meeting cost equation updates every second:
$$\text{Total Cost} = \text{Per-Second Rate} \times \text{Elapsed Time (seconds)}$$When you include overhead multipliers, the calculator applies them to each participant’s base rate before summing the total. This ensures accurate representation of true employment costs including benefits, taxes, and facility expenses.
Advanced Features for Meeting Management
The overspend tracking feature compares actual meeting costs against planned budgets. When you set a planned duration, the calculator highlights when meetings exceed their intended timeframe and budget allocation. This creates accountability for meeting facilitators and helps organizations understand the financial impact of poor time management.
The cost accumulation chart visualizes spending patterns throughout the meeting duration. You can identify expensive discussion periods and use this data to optimize future meeting agendas. Sharp cost increases often correlate with off-topic discussions or unnecessary debate.
Individual participant tracking in advanced mode allows precise cost allocation for project budgeting and client billing. You can assign different rates to various team members based on their roles, experience levels, and compensation packages.
Practical Applications and Example Calculations
Consider a typical product planning meeting with diverse participants. Your team includes two senior developers at $95,000 annual salary each, one product manager at $120,000 annually, and one designer at $80,000 per year. With a 1.35 overhead multiplier, the calculation proceeds as follows:
Developer hourly rate: $95,000 ÷ (52 × 40) = $45.67 per hour Product manager hourly rate: $120,000 ÷ 2,080 = $57.69 per hour Designer hourly rate: $80,000 ÷ 2,080 = $38.46 per hour
After applying the 1.35 overhead multiplier: Total effective hourly rate = (2 × $45.67 × 1.35) + ($57.69 × 1.35) + ($38.46 × 1.35) = $189.61 per hour
This translates to $3.16 per minute or approximately $0.053 per second. A 90-minute meeting costs your organization $284.42 in participant time alone.
Budget Planning and Cost Optimization
Use the planned duration feature to set meeting budgets before sessions begin. If you budget $200 for a weekly team standup, the calculator shows exactly when you exceed this threshold. Many organizations discover their “quick” 15-minute standups actually run 35-40 minutes, doubling the intended cost.
The pause functionality handles breaks, late arrivals, and technical difficulties accurately. When participants take a 10-minute coffee break, pause the calculator to avoid inflating the actual meeting cost. Resume tracking when productive discussion continues.
Download meeting summaries for expense reporting and efficiency analysis. The JSON export includes timestamps, cost progression data, and participant information for integration with project management tools and financial reporting systems.
Meeting Efficiency Strategies
Display the live cost counter prominently during meetings to maintain focus and urgency. Participants naturally reduce tangential discussions when they see the financial impact of extended conversations. This psychological effect improves meeting discipline without aggressive moderation.
Compare costs across different meeting formats and participant combinations. You might discover that including senior executives in routine updates costs significantly more than having team leads brief them separately. The calculator quantifies these trade-offs with precise financial data.
Track recurring meeting costs over time to identify optimization opportunities. Weekly meetings that consistently exceed planned duration indicate agenda problems or inefficient discussion practices that require attention.
Integration with Business Processes
Meeting cost data integrates with project budgeting and client billing workflows. Service organizations can allocate meeting expenses to specific client accounts or project phases using the detailed participant tracking and time logs generated by the calculator.
HR departments use meeting cost analysis to justify training investments in meeting efficiency and facilitation skills. When you can demonstrate that poor meeting practices cost thousands of dollars monthly, efficiency training programs show clear ROI potential.
The calculator supports multiple currencies for international teams and global organizations. Cost calculations automatically format according to the selected currency, ensuring accurate financial reporting regardless of your team’s geographic distribution.
Important Disclaimer
The calculations, results, and content provided by our tools are not guaranteed to be accurate, complete, or reliable. Users are responsible for verifying and interpreting the results. Our content and tools may contain errors, biases, or inconsistencies. Do not enter personal data, sensitive information, or personally identifiable information in our web forms or tools. Such data entry violates our terms of service and may result in unauthorized disclosure to third parties. We reserve the right to save inputs and outputs from our tools for the purposes of error debugging, bias identification, and performance improvement. External companies providing AI models used in our tools may also save and process data in accordance with their own policies. By using our tools, you consent to this data collection and processing. We reserve the right to limit the usage of our tools based on current usability factors.
