Is this tool helpful?
How to Use the Market Share Calculator Effectively
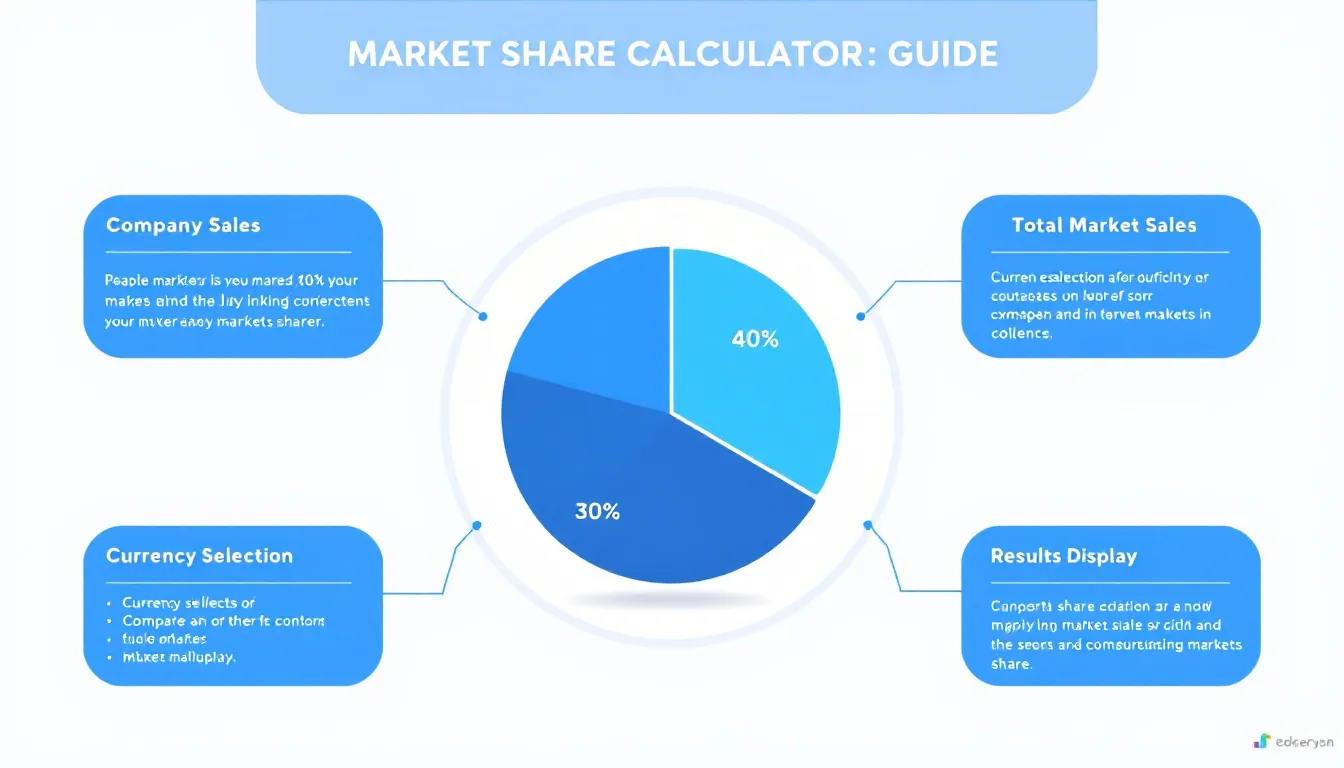
This calculator helps you determine your company’s market share by comparing your sales with the total market sales. Here’s how to fill in each field correctly for accurate results:
Input Fields
- Company Sales: Enter your business’s total sales amount for the period you want to analyze. For example, input 2,350,000 if your sales reached $2,350,000, or enter 5,800,000 if you had $5,800,000 in revenue.
- Currency Selection: Choose the currency that applies to your sales figures (USD, EUR, or GBP). The calculator then formats the numbers accordingly. If your sales are in Euros, select EUR. For British Pounds, select GBP.
- Total Market Sales: Enter the total sales volume for your entire market during the same period. For example, input 30,000,000 to represent a market worth $30 million, or 12,500,000 for a $12.5 million market.
What Is the Market Share Calculator and Why Use It?
The Market Share Calculator measures the percentage of total market sales that your company captures. It reveals your competitive position and helps you track changes over time. This tool provides an instant calculation along with a clear pie chart to visualize your company’s slice compared to competitors.
By understanding your market share, you gain insights into your company’s strengths, identify growth opportunities, and make data-driven business decisions. It works well for businesses in retail, manufacturing, services, and other industries aiming to understand their market standing.
Example Calculations Using the JavaScript Market Share Calculator
Basic Market Share Calculation
Suppose you run a tech accessories store. Last year:
- Company Sales: $4,500,000
- Total Market Sales: $27,000,000
The market share percentage is calculated as:
$$\text{Market Share (\%)} = \frac{\text{Company Sales}}{\text{Total Market Sales}} \times 100 = \frac{4,500,000}{27,000,000} \times 100 = 16.67\%$$This means your store accounts for 16.67% of the total market sales in your category.
Tracking Market Share Growth Over Time
Use the calculator quarterly to analyze growth trends. For example:
- Q1 Sales: $3,200,000 in a $20,000,000 market (16.00%)
- Q2 Sales: $3,600,000 in a $21,500,000 market (16.74%)
The increase from 16.00% to 16.74% shows positive market share growth.
Benefits of Using the Market Share Calculator for Business Analysis
Strategic Insight and Decision Making
- Visualize your company’s competitive position instantly
- Evaluate real-time market performance with accurate percentages
- Support strategy development based on market share trends
- Identify strengths and weaknesses compared to market competitors
Simplifying Business Planning
- Streamline market analysis with a quick, easy-to-use tool
- Compare market share across regions or time periods effortlessly
- Enhance communication with stakeholders through clear visuals
- Track your market share growth across product lines or divisions
Key Practical Applications of the Market Share Calculator
Use Case: Regional Market Analysis
If you manage sales in multiple regions, you can compare market shares as follows:
- East Region: $7,500,000 sales in $40,000,000 market (18.75%)
- West Region: $6,300,000 sales in $35,000,000 market (18.00%)
This helps pinpoint where your company performs best and where there’s room for improvement.
Use Case: Manufacturing Industry Market Position
A manufacturer can review annual sales data:
- Year 1: $14,000,000 sales in $90,000,000 market (15.56%)
- Year 2: $17,000,000 sales in $95,000,000 market (17.89%)
These figures highlight shifts in market share and help guide production or marketing decisions.
Best Practices for Accurate Market Share Analysis
Data Collection Tips
- Collect data for consistent time periods (monthly, quarterly, yearly)
- Use the same currency for all sales data to avoid conversion errors
- Include sales from all relevant channels, online and offline
- Update market data regularly to reflect the latest industry trends
Analysis Frequency Recommendations
- Use monthly monitoring in rapidly changing markets
- Quarterly tracking works well for most industries
- Conduct annual comprehensive reviews for strategic planning
- Perform special analyses when market events or disruptions occur
Frequently Asked Questions About Market Share Analysis
General Questions
Q: What is a healthy market share percentage?
Your ideal market share depends on your industry. In crowded sectors, 5% may be strong. In niche markets, reaching 30% or higher is common.
Q: How often should I calculate my market share?
Quarterly calculations meet the needs of most businesses, but competitive markets may require monthly checks.
Q: Can I compare market shares using different currencies?
Yes, but convert all numbers to a single currency using consistent exchange rates for meaningful comparisons.
Technical Questions
Q: Does seasonality affect market share calculations?
Yes. Compare the same periods year-over-year (e.g., Q1 of this year vs. Q1 last year) to account for seasonal effects.
Q: Should I include both online and offline sales in my calculations?
Yes. Including all sales channels ensures an accurate market share assessment.
Q: How do I use market share data for forecasting?
Analyze trends over time and relate them to overall market growth to predict future positions.
Strategic Questions
Q: How can I increase my market share?
Focus on improving your competitive edge, retaining customers, expanding markets, and innovating products.
Q: Should I track market share by segment?
Yes. Segment-wise analysis reveals targeted opportunities for growth.
Q: Does higher market share guarantee profitability?
Not always. While a larger share often brings economies of scale, maintaining profits requires balanced strategies.
Advanced Market Share Analysis Techniques
Competitive Benchmarking
- Identify your main competitors
- Compare relative market shares to understand your position
- Analyze growth rates across competitors
- Watch market concentration and potential risks
Monitoring Market Share Velocity
- Calculate quarter-over-quarter market share changes
- Compare year-over-year trends for long-term insights
- Relate market share growth to overall industry growth
- Track how quickly your share penetrates the market
Important Disclaimer
The calculations, results, and content provided by our tools are not guaranteed to be accurate, complete, or reliable. Users are responsible for verifying and interpreting the results. Our content and tools may contain errors, biases, or inconsistencies. Do not enter personal data, sensitive information, or personally identifiable information in our web forms or tools. Such data entry violates our terms of service and may result in unauthorized disclosure to third parties. We reserve the right to save inputs and outputs from our tools for the purposes of error debugging, bias identification, and performance improvement. External companies providing AI models used in our tools may also save and process data in accordance with their own policies. By using our tools, you consent to this data collection and processing. We reserve the right to limit the usage of our tools based on current usability factors.