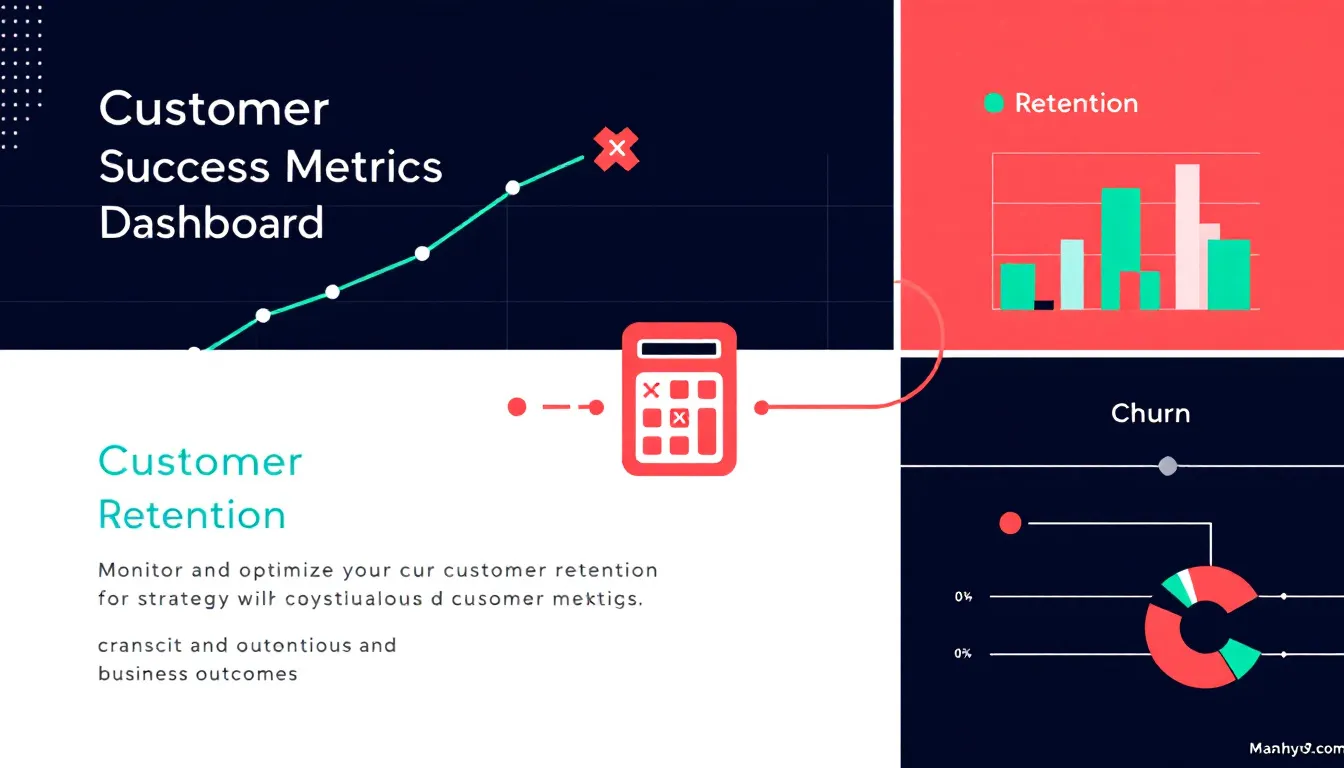
Customer Success Metrics Calculator
How to Use the Customer Success Metrics Calculator Effectively
This calculator helps you analyze key customer success metrics by inputting data about your customers, revenue, and marketing efforts. Follow these steps for accurate results:
-
Select the Time Period: Choose whether you want to calculate metrics for a Month, Quarter, or Year.
Example: Select “Quarter” to analyze data from the last three months.
-
Input Customer Data: Enter important figures about your customer base.
- Total Customers at Start of Period (e.g., 3500)
- Total Customers at End of Period (e.g., 3900)
- New Customers Acquired (e.g., 600)
- Customers Lost (e.g., 200)
-
Provide Financial Information: Add sales, marketing, and revenue numbers.
- Total Sales and Marketing Expenses (e.g., $65,000)
- Total Revenue (e.g., $950,000)
- Average Purchase Value (e.g., $180)
-
Enter Customer Behavior Metrics: Include data on purchases and customer retention.
- Total Number of Purchases (optional, e.g., 4200)
- Average Purchase Frequency Rate (optional, e.g., 3.0)
- Average Customer Lifespan (in years, e.g., 4.2)
-
Provide Subscription and User Data: Add subscriber and active user counts.
- Number of Subscribers (e.g., 3100)
- Number of Active Users (e.g., 5200)
-
Input Customer Satisfaction Data: Share survey results reflecting customer happiness.
- Number of Satisfied Customers (e.g., 770)
- Total Number of Survey Responses (e.g., 900)
-
Enter Net Promoter Score (NPS) Data: Enter customers based on their NPS ratings.
- NPS Detractors (scores 0-6, e.g., 120)
- NPS Passives (scores 7-8, e.g., 280)
- NPS Promoters (scores 9-10, e.g., 500)
-
Provide Additional Revenue Information: Input details regarding revenue growth.
- Additional Revenue from Existing Customers (e.g., $150,000)
- Total Revenue at Start of Period (e.g., $850,000)
- Select Your Preferred Currency: Choose the currency for monetary values (USD, EUR, GBP).
What Is the Customer Success Metrics Calculator?
The Customer Success Metrics Calculator is a practical tool that measures key performance indicators related to your customers’ behavior, retention, and satisfaction. By inputting your business data, you get insights that help you understand:
- Customer churn and retention rates: How well you keep your customers over time.
- Customer acquisition cost (CAC): How much you spend to gain new customers.
- Customer lifetime value (CLV): The total revenue you can expect from a single customer.
- Net Promoter Score (NPS) and Customer Satisfaction (CSAT): Indicators of customer loyalty and happiness.
- Revenue metrics: Performance signals like monthly recurring revenue (MRR) and average revenue per user (ARPU).
Using this calculator regularly helps you track customer success trends, optimize marketing strategies, and improve your overall business performance.
Example Calculations Using the Calculator
Here’s how the calculator derives some of its key metrics based on your inputs:
1. Churn Rate
Measures the percentage of customers lost during the selected period.
$$ \text{Churn Rate} = \left(\frac{\text{Customers Lost}}{\text{Total Customers at Start}}\right) \times 100 $$For example, if you started with 3,500 customers and lost 200:
Churn Rate = (200 / 3500) × 100 = 5.71%
2. Retention Rate
Shows the percentage of customers retained excluding new customers acquired.
$$ \text{Retention Rate} = \left(\frac{\text{Total Customers at End} – \text{New Customers}}{\text{Total Customers at Start}}\right) \times 100 $$If you had 3,900 customers at the end and acquired 600 new ones:
Retention Rate = ((3900 – 600) / 3500) × 100 = 91.43%
3. Customer Acquisition Cost (CAC)
Average cost spent to acquire each new customer.
$$ \text{CAC} = \frac{\text{Total Sales and Marketing Expenses}}{\text{New Customers Acquired}} $$With $65,000 marketing spend and 600 new customers:
CAC = 65,000 / 600 = $108.33
4. Customer Lifetime Value (CLV)
Estimated revenue from a customer over their lifespan.
$$ \text{CLV} = \text{Average Purchase Value} \times \text{Average Purchase Frequency} \times \text{Average Customer Lifespan} $$Using $180 for average purchase, 3 purchases per year, and 4.2 years lifespan:
CLV = 180 × 3 × 4.2 = $2,268
5. Net Promoter Score (NPS)
Evaluates customer loyalty by subtracting detractors from promoters and expressing the result as a percentage.
$$ \text{NPS} = \left(\frac{\text{Promoters} – \text{Detractors}}{\text{Total Responses}}\right) \times 100 $$For 500 promoters, 120 detractors, and 900 total responses:
NPS = ((500 – 120) / 900) × 100 = 42.22%
6. Customer Satisfaction Score (CSAT)
Percentage of surveyed customers who reported satisfaction.
$$ \text{CSAT} = \left(\frac{\text{Satisfied Customers}}{\text{Total Survey Responses}}\right) \times 100 $$For 770 satisfied out of 900 responses:
CSAT = (770 / 900) × 100 = 85.56%
7. Monthly Recurring Revenue (MRR)
Average recurring revenue per subscriber in the period.
$$ \text{MRR} = \frac{\text{Total Revenue}}{\text{Number of Subscribers}} $$With $950,000 revenue and 3,100 subscribers:
MRR = 950,000 / 3,100 = $306.45
8. Average Revenue Per User (ARPU)
Average revenue generated from each active user.
$$ \text{ARPU} = \frac{\text{Total Revenue}}{\text{Number of Active Users}} $$Using 5,200 active users:
ARPU = 950,000 / 5,200 = $182.69
9. Expansion Revenue Rate
Percentage increase in revenue from existing customers over the start revenue.
$$ \text{Expansion Revenue Rate} = \left(\frac{\text{Additional Revenue from Existing Customers}}{\text{Total Revenue at Start}}\right) \times 100 $$With $150,000 additional revenue and $850,000 starting revenue:
Expansion Revenue Rate = (150,000 / 850,000) × 100 = 17.65%
Benefits of Using This Customer Success Metrics Calculator
- Gain clear insights into customer retention and acquisition to guide your growth strategies.
- Track profitability by understanding how much you spend acquiring customers versus the revenue they bring.
- Measure customer satisfaction and loyalty with industry-standard metrics like NPS and CSAT.
- Optimize marketing efforts by pinpointing areas with high or low returns.
- Monitor revenue health through detailed metrics such as MRR and ARPU.
By regularly updating your data and reviewing the calculated metrics, you gain a powerful way to make data-driven decisions that improve customer relationships and financial results.
Is this tool helpful?
Important Disclaimer
The calculations, results, and content provided by our tools are not guaranteed to be accurate, complete, or reliable. Users are responsible for verifying and interpreting the results. Our content and tools may contain errors, biases, or inconsistencies. Do not enter personal data, sensitive information, or personally identifiable information in our web forms or tools. Such data entry violates our terms of service and may result in unauthorized disclosure to third parties. We reserve the right to save inputs and outputs from our tools for the purposes of error debugging, bias identification, and performance improvement. External companies providing AI models used in our tools may also save and process data in accordance with their own policies. By using our tools, you consent to this data collection and processing. We reserve the right to limit the usage of our tools based on current usability factors.