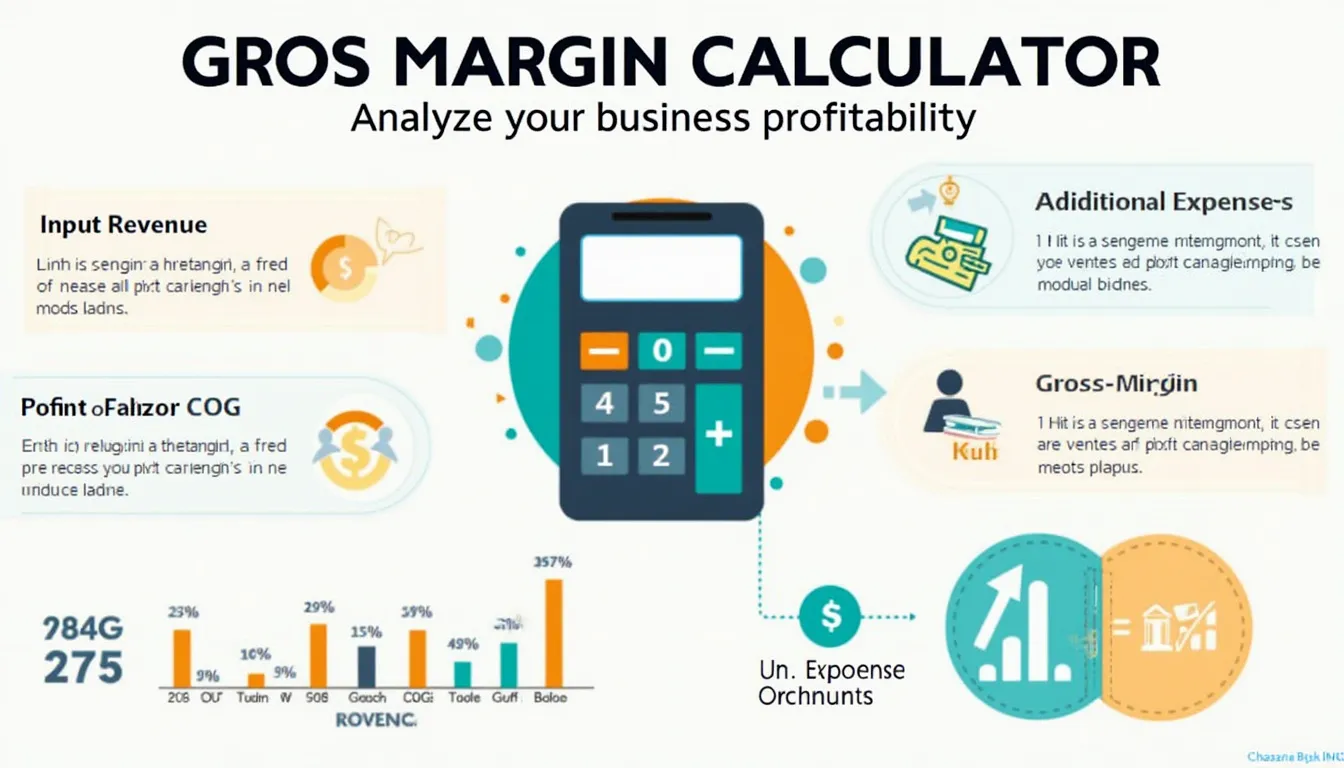
Gross Margin Calculator: Analyze Your Business Profitability Instantly
Gross margin shows what share of each sales dollar you keep after direct costs—U.S. retailers average 23.5% (Damodaran, 2023). This calculator subtracts COGS and optional direct expenses from revenue, then divides the result by revenue to reveal both gross profit and gross-margin %. Just enter your numbers and read the instant verdict.
Results
Gross Profit:
Gross Margin:
★ Add to Home Screen
×
Follow these steps:
Tap the Share button at the bottom of the browser
Scroll down and tap “Add to Home Screen”
Tap “Add” to confirm
Follow these steps:
Tap the menu icon (⋮) in the top right
Tap “Add to Home screen”
Tap “Add” to confirm
Follow these steps:
Click the menu icon (⋮) in the top right
Click “Bookmarks”
Click “Bookmark this tab” or press Ctrl+D (Cmd+D on Mac)
Is this tool helpful?
Thanks for your feedback!
How to use the tool
Enter revenue – e.g., $325,000 or $2,350,000.
Add COGS – e.g., $220,000 or $1,400,000.
Optional direct expenses – e.g., $12,500 or $45,000.
Hit “Calculate” to display gross profit and gross-margin %.
Gross margin is the percentage of sales revenue left after paying for the product or service’s direct costs — “the money left over after paying for goods sold” (Investopedia, 2023).
How does this calculator work?
You enter revenue, COGS and optional direct expenses. The script subtracts costs to find gross profit, divides by revenue, then multiplies by 100 to produce gross-margin % — all in your browser, no data stored.
Does gross margin include rent, marketing or salaries?
No. Those fall under operating expenses. Gross margin considers only costs directly tied to production, matching the IRS definition of COGS (IRS Pub 334, 2023).
What is a “good” gross margin?
Benchmarks vary: U.S. retail averages 23.5 % while mature SaaS firms aim for 70 % or higher (Bessemer Cloud Index, 2023).
How can I improve my margin?
Raise prices, negotiate supplier discounts, automate manufacturing, or reduce waste. McKinsey found lean initiatives lift manufacturing margins by 3-5 points (McKinsey Operations Practice, 2022).
Is the tool suitable for service businesses?
Yes. Replace COGS with direct labor and subcontractor fees to compute service gross margin, the metric investors track for professional-services firms (PwC Global Services Report, 2022).
Can I model “what-if” scenarios?
Change any field and recalculate instantly. This lets you test pricing or cost changes in seconds without spreadsheets.
Why use gross margin over net profit?
Gross margin isolates production efficiency. Net profit includes overhead, taxes and financing, which can obscure manufacturing or delivery cost issues (FASB Statement 220, 2021).
Important Disclaimer
The calculations, results, and content provided by our tools are not guaranteed to be accurate, complete, or reliable. Users are responsible for verifying and interpreting the results. Our content and tools may contain errors, biases, or inconsistencies. Do not enter personal data, sensitive information, or personally identifiable information in our web forms or tools. Such data entry violates our terms of service and may result in unauthorized disclosure to third parties. We reserve the right to save inputs and outputs from our tools for the purposes of error debugging, bias identification, and performance improvement. External companies providing AI models used in our tools may also save and process data in accordance with their own policies. By using our tools, you consent to this data collection and processing. We reserve the right to limit the usage of our tools based on current usability factors.