Employee Net Promoter Score Calculator
Is this tool helpful?
How to Use the Employee Net Promoter Score (eNPS) Calculator Effectively
Step-by-Step Instructions
This Employee Net Promoter Score calculator helps you measure workforce satisfaction quickly and accurately. Follow these simple steps to get reliable results:
-
Select Your Data Entry Method: You can choose between two input methods:
- Enter the number of responses for each individual score from 0 to 10.
- Enter aggregate counts for Promoters, Passives, and Detractors only.
-
Input Your Data: Depending on your chosen method:
- Individual Scores: Enter how many employees gave each score between 0 and 10.
- Aggregate Counts: Enter total numbers of Promoters (scores 9-10), Passives (scores 7-8), and Detractors (scores 0-6).
- Calculate Your eNPS: Click the calculate button to generate your results.
- Review Your Results: View the total respondents, percentage breakdown by category, your calculated eNPS score, and visual charts.
Sample Inputs for Practice
Example 1: Individual Score Entries
- Score 0: 4 responses
- Score 1: 7 responses
- Score 2: 6 responses
- Score 3: 8 responses
- Score 4: 12 responses
- Score 5: 14 responses
- Score 6: 19 responses
- Score 7: 21 responses
- Score 8: 23 responses
- Score 9: 28 responses
- Score 10: 30 responses
Example 2: Aggregate Count Entries
- Promoters: 58
- Passives: 47
- Detractors: 55
After entering these values, click the calculate button to see your eNPS score and category distributions.
Employee Net Promoter Score (eNPS) Calculator: Definition, Purpose, and Benefits
What is eNPS?
The Employee Net Promoter Score (eNPS) is a straightforward metric that measures employee loyalty and satisfaction within your organization. Adapted from the Net Promoter Score (NPS) used in customer experience, eNPS gauges how likely your employees are to recommend your company as a workplace.
Purpose of the eNPS Calculator
This calculator helps managers, HR professionals, and organizational leaders collect feedback, analyze employee sentiment, and make informed decisions. It converts raw survey data into actionable insights with minimal effort.
Key Benefits of the eNPS Calculator
- Fast Employee Satisfaction Assessment: Quickly calculate your workplace’s loyalty score.
- Reliable Data for HR Decisions: Automates calculation to avoid errors and save time.
- Trend Monitoring: Track changes in employee opinion over months or years.
- Visual Insights: See data clearly with easy-to-understand charts.
- Flexible Input Options: Accommodates different survey formats, from detailed scores to summary counts.
- Benchmarking: Compare your eNPS to industry standards and competitors.
How the eNPS Calculator Works: Calculations and Examples
Understanding eNPS Categories
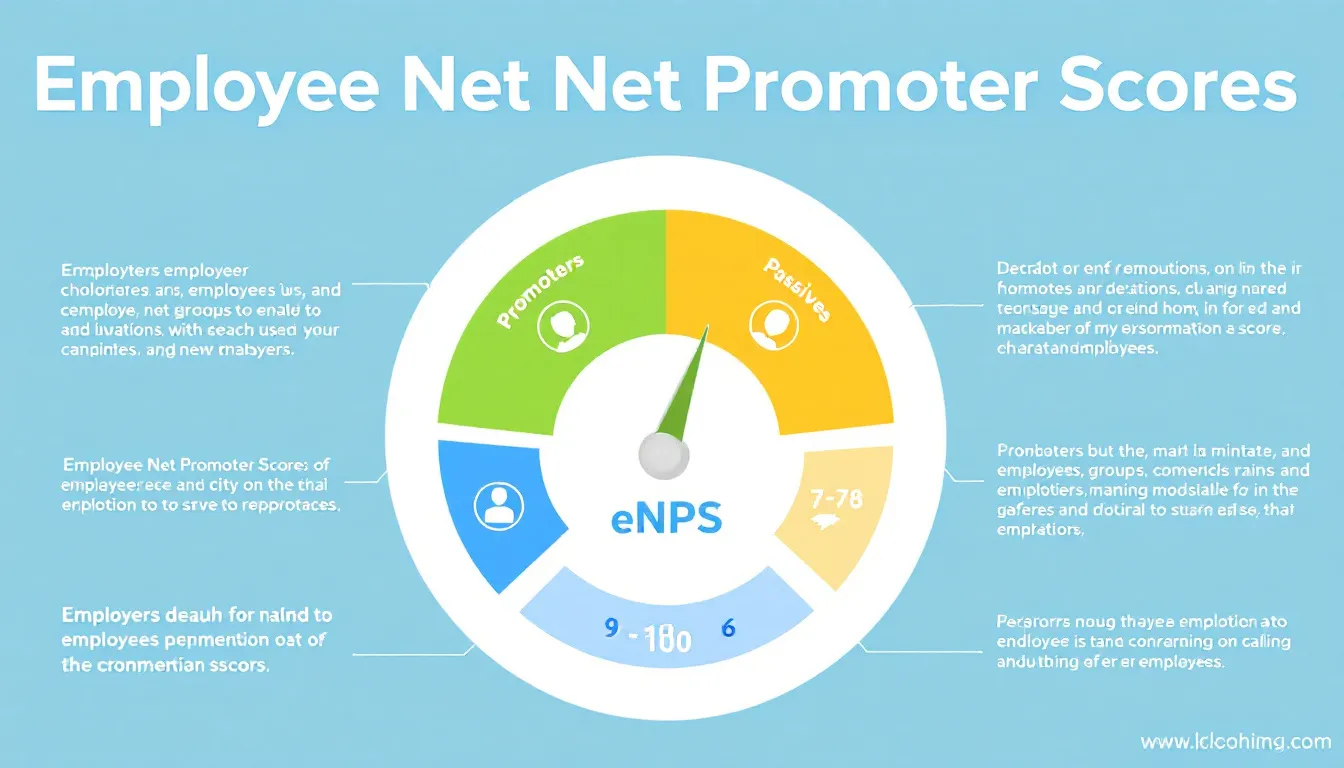
Employees responding to the question “On a scale of 0 to 10, how likely are you to recommend our company as a place to work?” fall into three groups based on their rating:
- Promoters (score 9-10): Loyal and enthusiastic employees.
- Passives (score 7-8): Satisfied but unenthusiastic employees.
- Detractors (score 0-6): Unsatisfied employees who may harm your reputation.
Calculating the eNPS Score
The eNPS is calculated with this formula:
$$ eNPS = \left( \frac{\text{Number of Promoters} – \text{Number of Detractors}}{\text{Total Number of Respondents}} \right) \times 100 $$
Example Calculation
Using aggregate counts from Example 2 above:
- Promoters = 58
- Passives = 47
- Detractors = 55
Total respondents = 58 + 47 + 55 = 160.
Calculate:
$$ eNPS = \left(\frac{58 – 55}{160}\right) \times 100 = \frac{3}{160} \times 100 = 1.88 $$
This score indicates a slightly positive employee experience. Scores range from -100 (all detractors) to +100 (all promoters).
Interpreting Your eNPS Score
- Scores above 0 mean more promoters than detractors.
- A score between +10 and +30 is considered decent.
- Scores above +50 are excellent and indicate strong employee loyalty.
- Negative scores highlight issues needing urgent attention.
Practical Applications and Use Cases for the eNPS Calculator
1. Regular Employee Feedback Tracking
Use the calculator to measure satisfaction after engagement surveys conducted quarterly, biannually, or annually. It helps you monitor your workforce’s changing sentiment over time.
2. Comparing Departments or Teams
Input eNPS data for different departments to identify strengths and weaknesses across your organization. For instance, you may find Customer Service outperforms Warehousing, prompting targeted improvements.
3. Assessing Post-Change Impact
After organizational changes like mergers, leadership shifts, or policy updates, calculate eNPS to gauge employee reaction and adjust strategies accordingly.
4. Supporting HR Strategies
The eNPS calculator provides data-driven insights that enhance decision-making for recruitment, retention, training, and workplace culture initiatives.
Frequently Asked Questions About the Employee Net Promoter Score Calculator
Q1: How often should I measure eNPS?
You should measure eNPS regularly to track meaningful trends. Many organizations measure quarterly or biannually, but monthly or annual measurements can also work. The key is to remain consistent in your timing.
Q2: What is a good eNPS score?
Generally, a positive score (above 0) is good, showing you have more promoters than detractors. Aim for scores above +10 for solid employee loyalty. An excellent score is above +50. Always consider your specific industry and company context.
Q3: Can I use this eNPS calculator for customer NPS surveys?
Yes. The calculation principle is the same. As long as your survey uses the 0 to 10 rating scale and the standard Promoter, Passive, and Detractor categories, this calculator applies equally well to customer NPS data.
Q4: How do I improve my company’s eNPS score?
Improving eNPS means increasing your promoters and reducing detractors by:
- Listening to employee feedback and acting on concerns promptly.
- Enhancing communication and transparency.
- Recognizing and rewarding contributions.
- Providing growth and development opportunities.
- Creating a positive and inclusive work environment.
Important Disclaimer
The calculations, results, and content provided by our tools are not guaranteed to be accurate, complete, or reliable. Users are responsible for verifying and interpreting the results. Our content and tools may contain errors, biases, or inconsistencies. Do not enter personal data, sensitive information, or personally identifiable information in our web forms or tools. Such data entry violates our terms of service and may result in unauthorized disclosure to third parties. We reserve the right to save inputs and outputs from our tools for the purposes of error debugging, bias identification, and performance improvement. External companies providing AI models used in our tools may also save and process data in accordance with their own policies. By using our tools, you consent to this data collection and processing. We reserve the right to limit the usage of our tools based on current usability factors.