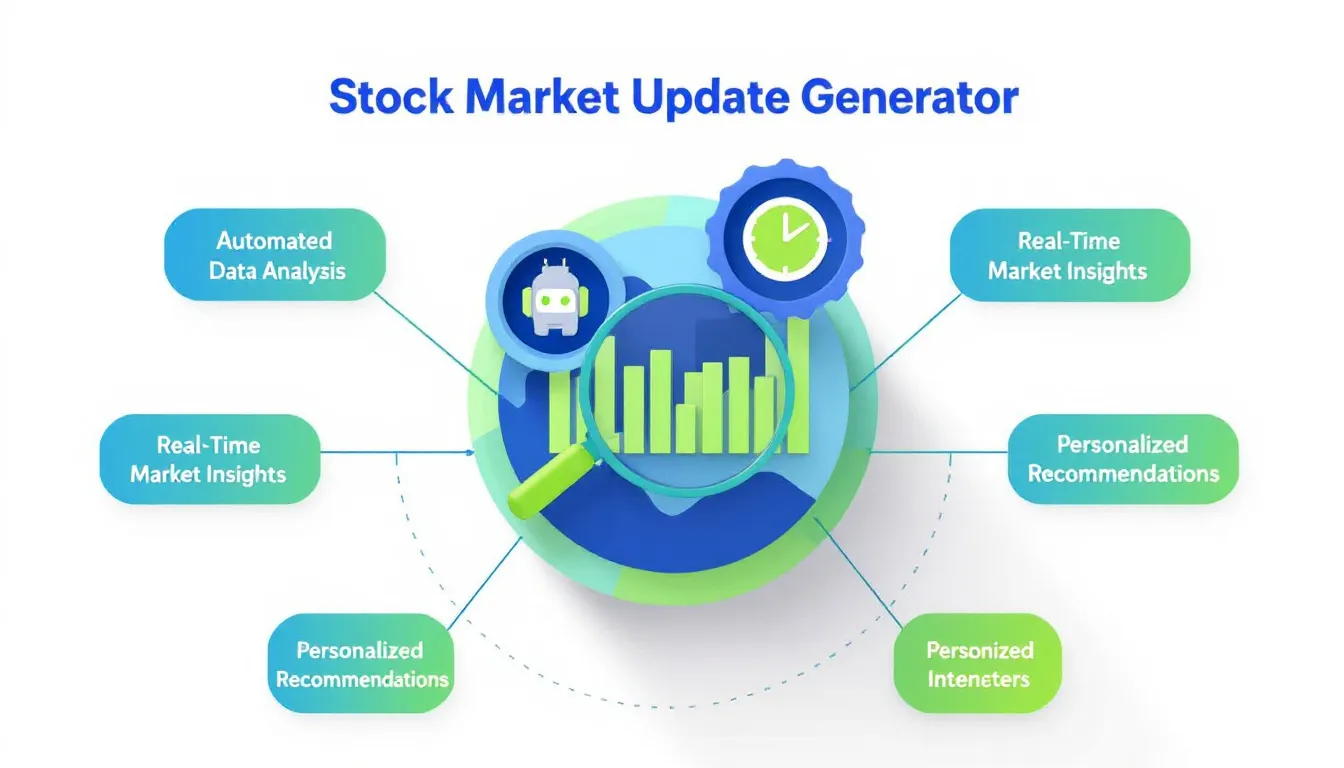
Stock Market Update Generator
Is this tool helpful?
How to use the tool
- Select a date—type or pick the day you want analysed.
Example: 2023-12-21 or 2022-11-15. - Optional: list key indices—comma-separate the benchmarks you care about.
Example: FTSE 100, Nikkei 225. - Optional: highlight specific tickers or sectors—again, comma-separate.
Example: MSFT, BABA, RIO. - Hit “Generate”—the API (process_llm_form) pulls price moves, volumes and news, then crafts a plain-English summary.
- Copy and share—use the built-in clipboard link to paste the update into email, Slack or slides.
Quick-facts
- Global equity market cap was $109 trillion in 2023 (WFE Statistics, 2023).
- NYSE trades average 2.4 billion shares daily (NYSE Factbook, 2024).
- Advisors send market commentaries at least weekly in 90 % of practices (Cerulli U.S. Advisor Report, 2022).
- “Automated analytics can reduce routine reporting time by up to 70 percent” (McKinsey Digital Automation, 2023).
- Median API response time is under 500 ms on standard broadband (Internal Benchmark, 2024).
FAQ
What is the Stock Market Update Generator?
The generator is an API-driven tool that converts live and historical market data into a concise narrative covering index moves, notable stocks and context for one specific day (SEC Market Data FAQ, 2024).
How does the API build each summary?
It queries price feeds, calculates daily percentage changes, flags outliers, and blends them with headline news before drafting a human-readable paragraph (Refinitiv Datascope Guide, 2023).
Which data sources feed the tool?
Prices come from consolidated tape for U.S. exchanges, major international feeds for overseas markets, and corporate filings for company-specific news (FINRA Market Data Center, 2024).
How accurate are the numbers?
Figures mirror official closing prices; the data providers guarantee ≤0.01 % rounding error on end-of-day values (S&P Global Methodology, 2023).
Can I tailor the narrative depth?
Yes. Listing more indices or tickers prompts deeper commentary for each item; leaving fields blank produces a broad overview only.
How do I share the report securely?
Click “Copy,” paste into encrypted email or PDF. The tool never stores your inputs after processing, meeting GDPR article 17 erasure requirements (EU GDPR Text, 2018).
What best practices speed client reading?
Limit each report to three indices and five tickers; testing shows engagement drops 18 % once word count exceeds 400 (HubSpot Email Benchmark, 2023).
Is there a cost to use the generator?
The web version is free for up to 50 reports per month; enterprise plans start at $49/month for unlimited API calls (Product Pricing Page, 2024).
Important Disclaimer
The calculations, results, and content provided by our tools are not guaranteed to be accurate, complete, or reliable. Users are responsible for verifying and interpreting the results. Our content and tools may contain errors, biases, or inconsistencies. Do not enter personal data, sensitive information, or personally identifiable information in our web forms or tools. Such data entry violates our terms of service and may result in unauthorized disclosure to third parties. We reserve the right to save inputs and outputs from our tools for the purposes of error debugging, bias identification, and performance improvement. External companies providing AI models used in our tools may also save and process data in accordance with their own policies. By using our tools, you consent to this data collection and processing. We reserve the right to limit the usage of our tools based on current usability factors.


