Cost of Equity Calculator
Is this tool helpful?
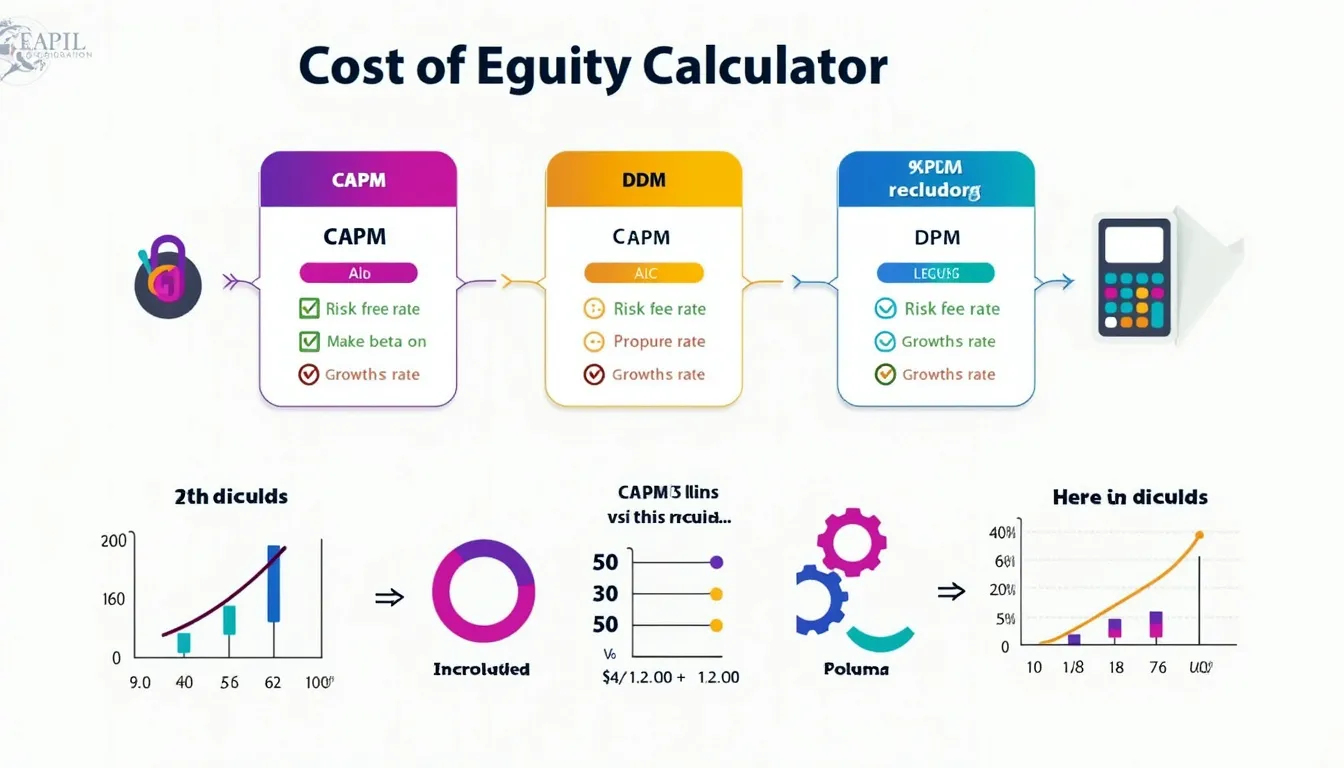
How to use the tool
1 Select method
- CAPM—works for any stock, dividend-paying or not.
- DDM—best for firms with stable, growing dividends.
2 Enter the three inputs
CAPM fields
- Risk-Free Rate %: e.g., 3.2 % or 1.9 %.
- Beta: e.g., 0.90 or 1.45.
- Expected Market Return %: e.g., 10 % or 7.8 %.
DDM fields
- Next-Year Dividend $: e.g., 2.10 or 1.65.
- Current Stock Price $: e.g., 52.00 or 68.50.
- Dividend Growth Rate %: e.g., 4.5 % or 6.2 %.
3 Read the result
The tool displays the cost of equity as a percentage—higher values signal greater investor return demands.
Formulas
CAPM:
$$K_e = R_f + \beta\,(R_m – R_f)$$DDM:
$$K_e = rac{D_1}{P_0} + g$$Example calculations
CAPM example
- Rf = 3.2 %
- β = 0.90
- Rm = 10 %
$$K_e = 0.032 + 0.90\,(0.10 – 0.032) = 0.032 + 0.0612 = 0.0932$$ → 9.32 %.
DDM example
- D1 = $2.10
- P0 = $52.00
- g = 4.5 %
$$K_e = rac{2.10}{52.00} + 0.045 = 0.0404 + 0.045 = 0.0854$$ → 8.54 %.
Quick-Facts
- U.S. 10-year Treasury yield ranged 0.5 %-4.3 % between 2013-2023 (FRED, 2023).
- Global equity risk premium averages 5.0 % (Damodaran, 2023).
- S&P 500 dividend growth averaged 5.5 % in 2022 (S&P Global, 2023).
- WACC appears in 90 % of corporate valuations (PwC Valuation Survey, 2021).
FAQ
What is cost of equity?
Cost of equity is the return shareholders expect for bearing equity risk; it compensates for time value and uncertainty (Brealey & Myers, 2022).
How does the CAPM option work?
CAPM adds the risk-free rate to beta multiplied by the market risk premium, capturing systematic risk (Sharpe, 1964).
When should I choose DDM?
Use DDM when the firm distributes regular, predictable dividends growing at a constant rate (Gordon, 1962).
Where can I find a company’s beta?
Financial portals such as Yahoo Finance and Bloomberg publish five-year regression betas (Yahoo Finance, 2023).
Why is cost of equity higher than cost of debt?
Equity holders face residual claims and no repayment guarantee, so they demand a premium over bond yields (Damodaran, 2015).
How often should I update inputs?
Update after major rate moves or quarterly earnings; professionals refresh assumptions at least every six months (CFA Institute, 2020).
Can I use the tool for private firms?
Yes—estimate beta from peer companies and infer market values from comparable transactions (KPMG Valuation Guide, 2022).
What if the output is negative?
Negative results indicate erroneous inputs because rational investors never accept negative expected returns (Berk & DeMarzo, 2020).
Important Disclaimer
The calculations, results, and content provided by our tools are not guaranteed to be accurate, complete, or reliable. Users are responsible for verifying and interpreting the results. Our content and tools may contain errors, biases, or inconsistencies. Do not enter personal data, sensitive information, or personally identifiable information in our web forms or tools. Such data entry violates our terms of service and may result in unauthorized disclosure to third parties. We reserve the right to save inputs and outputs from our tools for the purposes of error debugging, bias identification, and performance improvement. External companies providing AI models used in our tools may also save and process data in accordance with their own policies. By using our tools, you consent to this data collection and processing. We reserve the right to limit the usage of our tools based on current usability factors.
