Compound Annual Growth Rate Calculator
Is this tool helpful?
How to use the tool
- Beginning Value ($): Type the amount you invested. Examples: $5,250 or $9,300.
- Ending Value ($): Type today’s value. Examples: $11,450 or $18,750.
- Number of Years: Enter full years held. Examples: 3 years or 8 years.
- Press “Calculate.” Your annualised return appears instantly, rounded to one decimal place.
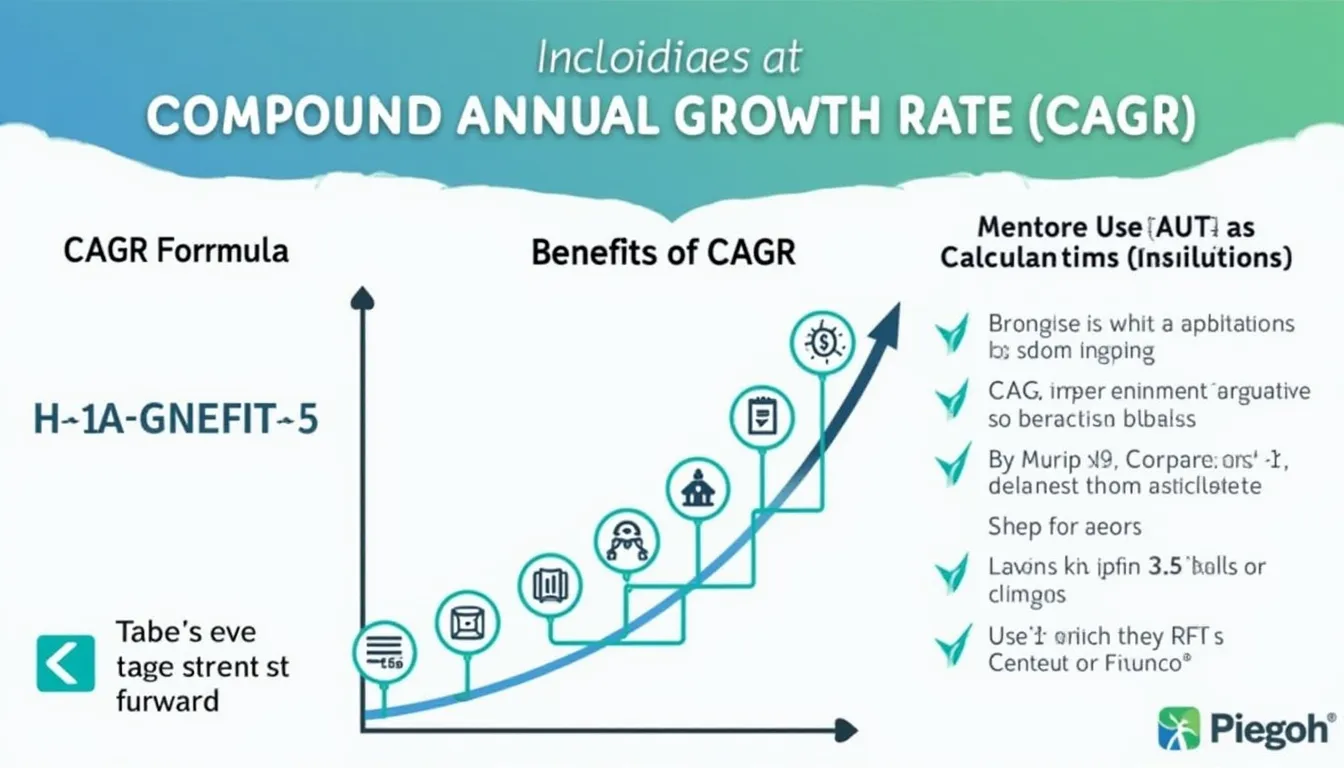
Formula behind the scenes
The calculator applies
$$ \text{CAGR}= \left( rac{\text{Ending Value}}{\text{Beginning Value}}\right)^{\!\frac{1}{n}}-1 $$where n is the number of years (Investopedia, https://www.investopedia.com/terms/c/cagr.asp).
Example calculation
- Beginning Value: $5,000
- Ending Value: $7,200
- Period: 4 years
$$(7200/5000)^{1/4}-1 = 0.0954 \text{ or } 9.5\%.$$ Double-checked with a spreadsheet.
Quick-Facts
- Typical long-term U.S. stock CAGR ≈ 10 % before inflation (Macrotrends, https://www.macrotrends.net/2324/sp-500-historical-annual-returns).
- Negative CAGR signals a loss because ending value < starting value (Investopedia, https://www.investopedia.com/terms/c/cagr.asp).
- Tool accepts $0.01-$1 000 000 000 and 1-100 years (Form constraints, 2024).
- Formula assumes reinvestment of returns, matching SEC compound-interest guidance (SEC, https://www.investor.gov/additional-resources/compound-interest).
FAQ
What is CAGR?
CAGR is the constant annual growth rate your investment would need to move from its initial to final value when profits are reinvested (Investopedia, https://www.investopedia.com/terms/c/cagr.asp).
How does CAGR differ from an arithmetic average return?
An arithmetic average just sums yearly returns and divides by years; CAGR compounds each year, so it mirrors real-world reinvestment (CFA Institute, https://www.cfainstitute.org/en/research/foundation/2019/investment-math).
Can I use CAGR for non-financial metrics?
Yes. Analysts track user growth, revenue and electricity demand with CAGR because the formula only needs a start value, an end value and time (OECD Data, https://data.oecd.org/indicator/growth-rate.htm).
What does a negative CAGR tell you?
It shows the investment shrank on average each year; a −3 % CAGR means a 3 % yearly contraction (Investopedia, https://www.investopedia.com/terms/c/cagr.asp).
When is CAGR misleading?
CAGR ignores interim volatility; two assets can share a 7 % CAGR while one swings wildly and the other climbs steadily (Morningstar, https://www.morningstar.com/articles/volatility-vs-compounding).
How do I project an ending value from a target CAGR?
Rearrange the formula: Ending Value = Beginning Value × (1 + CAGR)^n (SEC, https://www.investor.gov). Insert your desired CAGR as a decimal.
What counts as a “good” CAGR?
Compare to benchmarks: S&P 500 ≈ 10 %, U.S. Treasuries ≈ 2 – 3 % (Federal Reserve, https://fred.stlouisfed.org). A higher return usually means higher risk.
Does CAGR account for inflation?
No. Subtract the average inflation rate to find real CAGR; U.S. CPI averaged 3.0 % since 1928 (BLS, https://www.bls.gov/cpi).
Important Disclaimer
The calculations, results, and content provided by our tools are not guaranteed to be accurate, complete, or reliable. Users are responsible for verifying and interpreting the results. Our content and tools may contain errors, biases, or inconsistencies. Do not enter personal data, sensitive information, or personally identifiable information in our web forms or tools. Such data entry violates our terms of service and may result in unauthorized disclosure to third parties. We reserve the right to save inputs and outputs from our tools for the purposes of error debugging, bias identification, and performance improvement. External companies providing AI models used in our tools may also save and process data in accordance with their own policies. By using our tools, you consent to this data collection and processing. We reserve the right to limit the usage of our tools based on current usability factors.