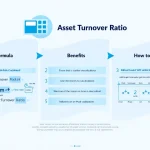
Asset to Sales Ratio Calculator
How to use the tool
- Total Assets: Type the book value of all assets. Sample inputs: 345 750.50 or 1 950 000.
- Sales Revenue: Enter net sales for the same period. Samples: 860 000 or 3 275 400.10.
- Press Calculate Ratio to display $$\frac{\text{Total Assets}}{\text{Sales Revenue}}$$ rounded to two decimals.
- Select Reset to clear both fields before a new run.
Example calculations
- Case 1: Assets = $500 000; Sales = $1 000 000 → Ratio = 0.50.
- Case 2: Assets = $2 400 000; Sales = $1 600 000 → Ratio = 1.50.
Quick-Facts
- Retail median ratio: 1.8× (Damodaran, 2024).
- Manufacturing median: 0.62× in 2023 (Damodaran, 2024).
- Utilities average only 0.31×, reflecting heavy infrastructure (Damodaran, 2024).
- IFRS 16 requires matching asset and revenue periods (IFRS.org, 2024).
What does the asset-to-sales ratio tell you?
The ratio shows how efficiently you convert asset dollars into revenue. A lower number means each dollar of assets produces more sales, signalling lean operations (Investopedia, https://www.investopedia.com).
What is a good benchmark?
Compare against your industry: technology hardware averages 0.88×, utilities 0.31×, and grocery retail 3.23× (Damodaran, 2024). Matching peers matters more than chasing a universal target.
Can the ratio be negative?
It turns negative only when net sales are negative, implying returns exceed sales—an acute distress sign (PwC Bankruptcy Report 2023).
How can you improve it?
Boost revenue via pricing or cut idle assets by selling surplus equipment; “asset productivity starts with unloading what no longer earns its keep” (Harvard Business Review, hbr.org/asset-productivity).
Should you include intangible assets?
Yes—“all recognised assets must be measured consistently” (IFRS 16, IFRS.org 2024). Include capitalised software, patents and goodwill if they appear on the balance sheet.
How often should you measure?
Recalculate every quarter to align with 10-Q filings and spot trend breaks early (SEC, Form 10-Q Instructions, sec.gov).
Does inflation distort comparisons?
Historical asset costs stay at purchase prices, so multi-year comparisons skew low. Restate to current dollars following FASB ASC 255-10-15 guidance (FASB.org).
Why exclude construction-in-progress?
Construction-in-progress lacks revenue-generating capacity, so analysts strip it out for cleaner efficiency reads (KPMG Global Insights 2023).
Is this tool helpful?
Important Disclaimer
The calculations, results, and content provided by our tools are not guaranteed to be accurate, complete, or reliable. Users are responsible for verifying and interpreting the results. Our content and tools may contain errors, biases, or inconsistencies. We reserve the right to save inputs and outputs from our tools for the purposes of error debugging, bias identification, and performance improvement. External companies providing AI models used in our tools may also save and process data in accordance with their own policies. By using our tools, you consent to this data collection and processing. We reserve the right to limit the usage of our tools based on current usability factors. By using our tools, you acknowledge that you have read, understood, and agreed to this disclaimer. You accept the inherent risks and limitations associated with the use of our tools and services.
