Sample Variance Calculator
Is this tool helpful?
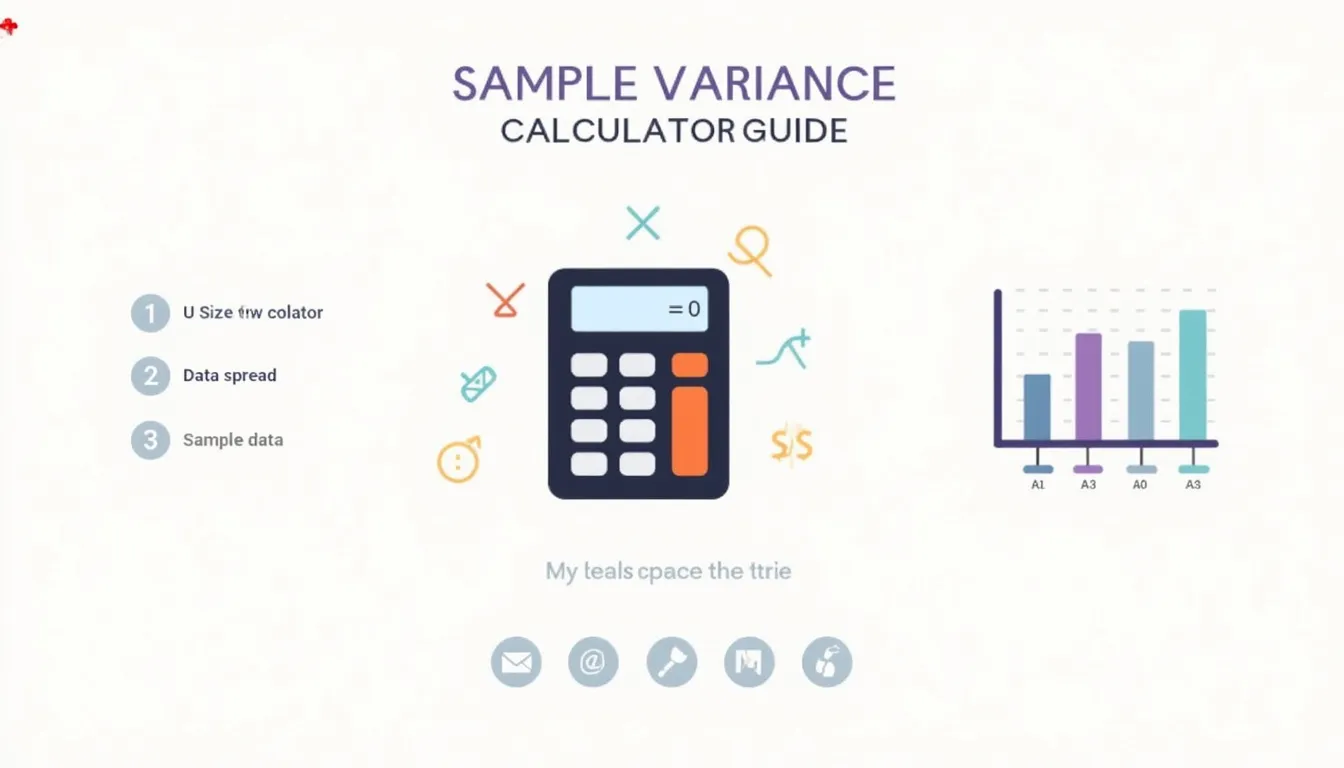
How to use the tool
- Enter your data in the input box, separating values with commas, spaces, or line breaks.
Sample input 1: 2 9 4 12 7
Sample input 2: 18, 23, 19, 27, 25, 30 - (Optional) Tick “Show Calculation Steps” to display every deviation, square, and subtotal.
- Press “Calculate.” The screen updates instantly with mean and sample variance, plus the full step list if selected.
- Interpret the numbers. A larger variance signals wider data spread; a variance of 0 means all values are identical.
Formulas applied by the JavaScript
Mean
$$ \bar{x}= rac{\sum_{i=1}^{n}x_i}{n} $$Sample variance (Bessel-corrected)
$$ s^{2}= rac{\sum_{i=1}^{n}(x_i-\bar{x})^{2}}{n-1} $$Worked example
- Data set: 3, 5, 7, 9
- Mean: $$\bar{x}= rac{3+5+7+9}{4}=6$$
- Squared deviations: 9, 1, 1, 9 (sum = 20)
- Variance: $$s^{2}= rac{20}{4-1}=6.6667$$
Quick-Facts
- Needs at least two observations to compute variance (Hogg & Tanis, 2019).
- Dividing by n – 1 yields an unbiased estimator—Bessel’s correction (Rice, 2006).
- Units are squared (e.g., cm² if input is cm) (NIST e-Handbook, 2023).
- A sample size ≥ 30 stabilises variance estimates (Montgomery & Runger, 2020).
FAQ
What is sample variance?
Sample variance measures how far your data points spread around their mean; higher numbers indicate more dispersion (NIST e-Handbook, 2023).
Why divide by n – 1 instead of n?
Subtracting one degree of freedom corrects downward bias in variability estimates—“Bessel’s correction makes the estimator unbiased” (Rice, 2006).
How much data do I need?
Two points are the minimum, but statisticians recommend 30 + observations for stable results (Montgomery & Runger, 2020).
How do I convert variance to standard deviation?
Take the square root: $$s= rac{\sqrt{\sum (x_i-\bar{x})^{2}/(n-1)}}{}$$ (NIST, 2023).
Can variance be negative?
No. Squaring deviations guarantees non-negative results (Hogg & Tanis, 2019).
How does variance appear in ANOVA?
ANOVA partitions total variance into within-group and between-group components to test mean differences (Fisher, 1925).
Do outliers affect variance?
Yes—variance increases sharply with extreme values because squared deviations amplify large gaps (Barnett & Lewis, 1994).
When should I use population variance?
Use population variance when every member of the group is measured; divide by n because no estimation bias exists (ISO 3534-1, 2006).
Important Disclaimer
The calculations, results, and content provided by our tools are not guaranteed to be accurate, complete, or reliable. Users are responsible for verifying and interpreting the results. Our content and tools may contain errors, biases, or inconsistencies. Do not enter personal data, sensitive information, or personally identifiable information in our web forms or tools. Such data entry violates our terms of service and may result in unauthorized disclosure to third parties. We reserve the right to save inputs and outputs from our tools for the purposes of error debugging, bias identification, and performance improvement. External companies providing AI models used in our tools may also save and process data in accordance with their own policies. By using our tools, you consent to this data collection and processing. We reserve the right to limit the usage of our tools based on current usability factors.