Is this tool helpful?
How to Use the Sales Performance Report Generator Effectively
Step-by-Step Instructions for Generating Detailed Sales Reports
Follow these steps to produce accurate and insightful sales performance reports tailored to your investment advisory firm’s needs:
- Select Sales Categories: Choose one or more product lines you want to analyze. For example, pick “Municipal Bonds, Equity Mutual Funds, Annuities” or “Index Funds, Retirement Plans, Health Insurance” to focus your report on those offerings.
- Choose Agent Names: Enter the names of agents whose sales performance you want to track. Examples include “Jessica, Mark, Olivia” or “Derek, Fiona, Andrew”.
- Set the Reporting Period: Define your desired reporting timeframe by selecting the start and end dates. You might specify a period such as March 1, 2024, to March 31, 2024 or Q1 2024 for quarterly insights.
- Input the Target Sales Amount: Provide your sales goal for the chosen period to monitor progress effectively. For instance, enter 120000 or 250000 dollars.
- Generate Your Report: Click the button to produce a comprehensive sales performance summary complete with visual charts and data breakdowns.
Comprehensive Sales Performance Tracking for Investment Advisory Firms
The Sales Performance Report Generator is a practical tool designed to help investment advisory firms monitor and improve their sales activities. It lets you create customized reports that capture sales across multiple product categories, evaluate individual agent results, and visualize trends over any timeframe.
By using this tool, you gain clear insights into your firm’s sales strengths and weaknesses, enabling data-driven decisions to guide coaching, strategy, and resource allocation.
Key Benefits of the Sales Performance Report Generator
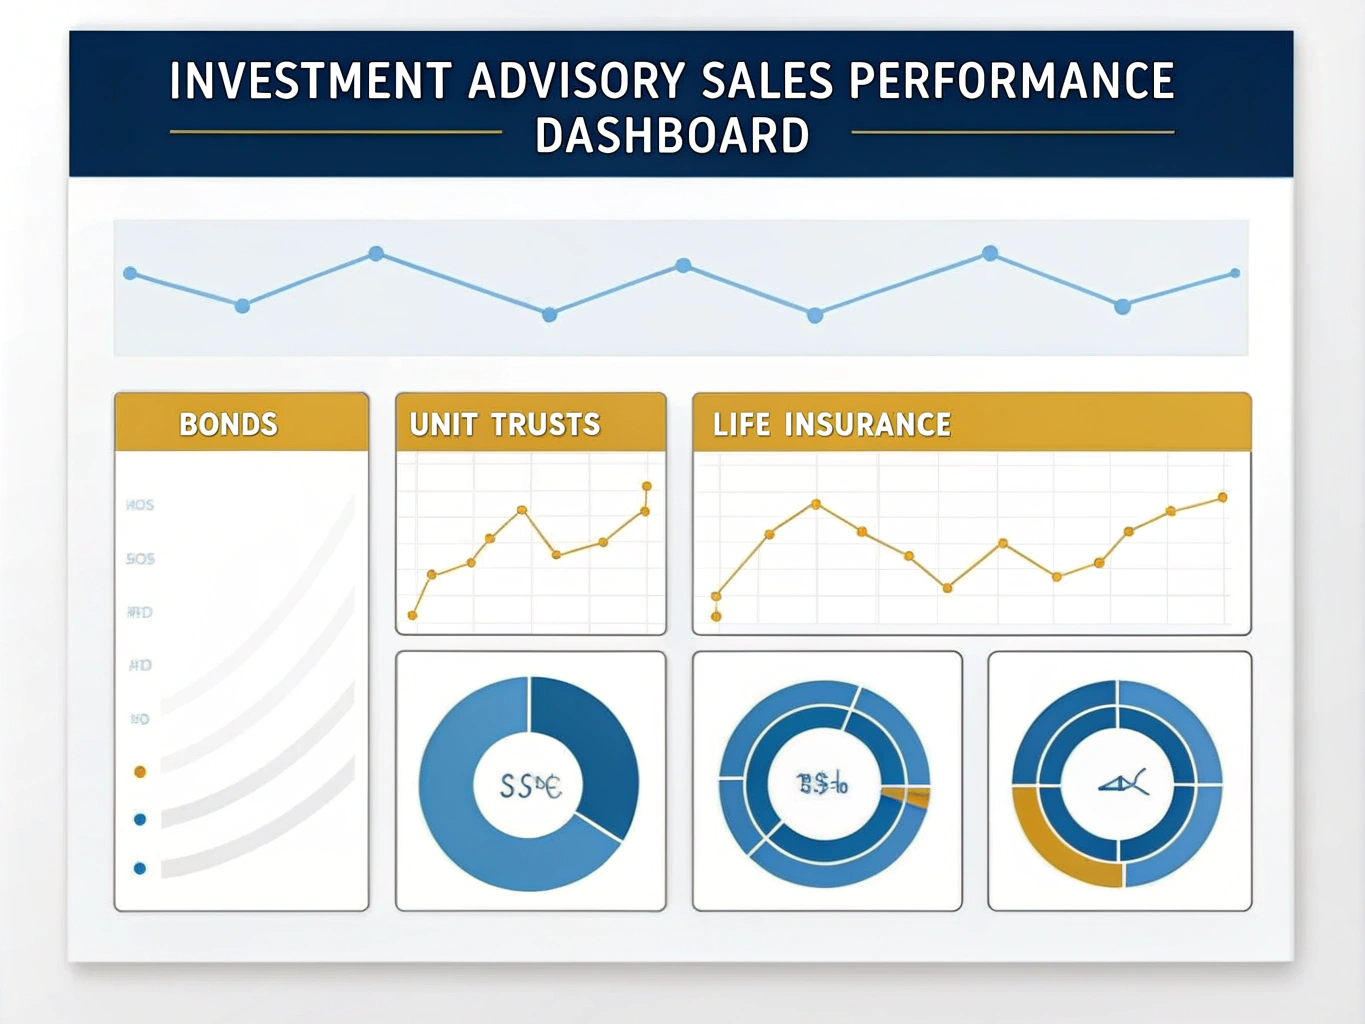
- Visualized Sales Data: Convert raw numbers into easy-to-understand charts that reveal performance patterns at a glance.
- Individual Agent Analysis: Track specific agent achievements, helping you recognize top performers and address gaps.
- Flexible Timeframes: Generate reports for any period, from weekly updates to quarterly reviews.
- Multiple Product Categories: Assess performance across diverse offerings, from bonds to insurance products.
- Goal Tracking: Compare actual sales with targets to evaluate progress and set adjustments.
Practical Uses and Scenarios for the Sales Performance Report Generator
Monthly Sales Meetings
Prepare detailed summaries to present during your team meetings. Cover points such as:
- Total sales per product category.
- Agent rankings based on sales figures.
- Progress toward monthly and quarterly objectives.
- Trend visuals to highlight increases or decreases in sales.
Agent Performance Reviews
Use the tool’s detailed reports to support one-on-one coaching, identifying strengths and growth areas. For example, if Agent Olivia excels with annuities but shows low sales in retirement plans, tailor training accordingly.
Product Strategy and Focus
Analyze sales distribution to balance your product portfolio. If reports reveal heavy concentration in municipal bonds but weak life insurance sales, you can adjust incentives or marketing efforts to correct this imbalance.
Designing Incentive Programs
Leverage sales data to create targeted reward structures. For instance, boost bonuses for agents who exceed targets in underperforming categories such as fixed income funds.
Client Reporting and Transparency
Use generated charts to illustrate your firm’s performance to clients, building trust by showing sales achievements across different investment products.
Frequently Asked Questions (FAQ)
Can I customize which sales categories appear in the report?
Yes, you can specify any sales categories relevant to your firm’s offerings, such as municipal bonds, fixed income funds, or variable annuities.
Is there a limit to the number of agents I can include?
No, you can include as many agents as needed, from a small team to a large sales force.
Can I generate reports for different durations?
Absolutely. You can choose any start and end dates allowing for weekly, monthly, or quarterly reports.
What types of visualizations does the tool provide?
The report includes bar charts by default, showing sales comparisons across categories and agents. This visualization simplifies identifying high and low performers.
Does the tool show sales progress compared to targets?
Yes, it highlights actual sales versus your specified target figures, helping you track progress and identify shortfalls quickly.
Can I view agent performance across all selected product categories?
Yes, the report breaks down each agent’s sales by category, giving a detailed look at strengths and areas needing improvement.
How can I save or share the generated reports?
After generating a report, you can copy the content to your clipboard and paste it into documents or spreadsheets for archiving or sharing.
Important Disclaimer
The calculations, results, and content provided by our tools are not guaranteed to be accurate, complete, or reliable. Users are responsible for verifying and interpreting the results. Our content and tools may contain errors, biases, or inconsistencies. Do not enter personal data, sensitive information, or personally identifiable information in our web forms or tools. Such data entry violates our terms of service and may result in unauthorized disclosure to third parties. We reserve the right to save inputs and outputs from our tools for the purposes of error debugging, bias identification, and performance improvement. External companies providing AI models used in our tools may also save and process data in accordance with their own policies. By using our tools, you consent to this data collection and processing. We reserve the right to limit the usage of our tools based on current usability factors.