Is this tool helpful?
How to Use the Revenue per Employee Calculator Effectively
Follow these simple steps to evaluate your company’s operational efficiency with this revenue per employee calculator:
- Step 1: Enter your company’s annual revenue in USD. For example, 3,200,000 or 7,850,000.
- Step 2: Input the total number of full-time employees (FTE). For example, 40 or 65.
- Step 3: Choose your primary industry from the dropdown menu: Technology, Finance, Retail, or Manufacturing.
After submitting the values, the calculator instantly computes your revenue per employee, compares it against industry benchmarks, and shows how your business performance stacks up.
What is the Revenue per Employee Calculator and Why Use It?
The revenue per employee calculator is an easy-to-use tool designed to measure your company’s workforce productivity by calculating the average revenue generated per full-time employee. This metric helps you understand how efficiently your business turns employee efforts into revenue.
Using this tool, you can:
- Identify operational inefficiencies in your team
- Guide hiring strategies and workforce planning
- Benchmark your performance against industry standards
- Support strategic decisions like budget allocation and business growth
How the Calculator Works: Formula and Industry Benchmarks
The fundamental formula behind the revenue per employee calculation is:
Using MathJax for clarity:
$$ \text{Revenue per Employee} = \frac{\text{Annual Revenue}}{\text{Number of Full-Time Employees}} $$This metric acts as a key performance indicator (KPI) to assess workforce productivity across different industries.
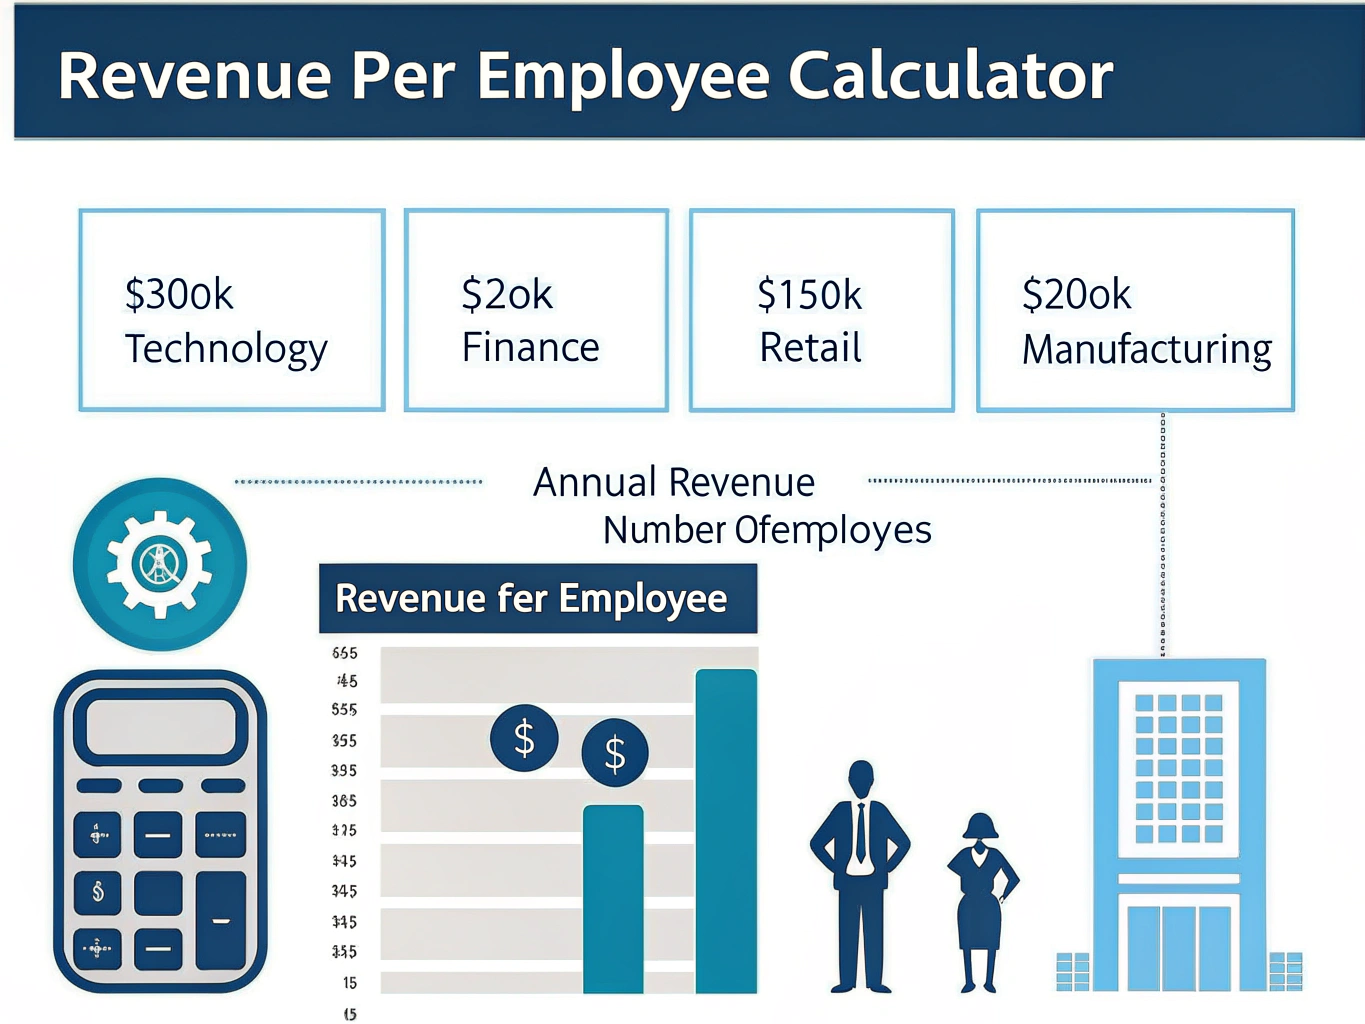
Industry Average Revenue per Employee
- Technology: $300,000 per employee
- Finance: $250,000 per employee
- Retail: $150,000 per employee
- Manufacturing: $200,000 per employee
Example Calculations to Understand Your Results
Example 1: Finance Firm
Suppose a finance company generates $9,000,000 annually with 30 full-time employees.
- Revenue per Employee = $9,000,000 ÷ 30 = $300,000
- This is 20% above the finance industry average of $250,000, indicating strong productivity.
Example 2: Manufacturing Company
Consider a manufacturing business with $6,800,000 in annual revenue and 45 employees.
- Revenue per Employee = $6,800,000 ÷ 45 ≈ $151,111
- This is around 25% below the industry average, suggesting room for operational improvement.
Key Benefits of Tracking Revenue per Employee
1. Strategic Workforce Management
- Spot operational bottlenecks and inefficiencies
- Make informed hiring and retention decisions
- Allocate resources to areas generating the most value
2. Performance Monitoring and Growth Evaluation
- Track workforce productivity over time
- Measure impact of process improvements
- Evaluate scalability and sustainability of business models
3. Informed Business Planning
- Optimize staffing to match revenue goals
- Design growth and expansion strategies backed by data
- Support budgeting and investment decisions with clear metrics
How to Interpret and Improve Your Revenue per Employee Ratio
Understanding Your Performance
Compare your calculated revenue per employee to the average in your industry to see whether your business is performing above or below the benchmark. A higher number means your workforce generates more revenue per person, signaling greater efficiency.
Improvement Strategies
- Invest in automation and productivity tools to streamline workflows
- Optimize business processes and reduce unnecessary tasks
- Provide training and development to enhance employee skills
- Focus on high-margin products or services
- Eliminate redundancies and improve operational focus
Industry-Specific Insights for Revenue per Employee
Technology Sector
Technology companies often achieve higher revenue per employee due to:
- Scalable digital products and services
- Extensive use of automation
- High-value intellectual property
Financial Services
Finance firms typically show:
- Moderate to high revenue per employee
- Revenue driven by specialized expertise and high-value transactions
- Complex and often personalized service models
Retail Sector
Retail businesses usually have lower revenue per employee because of:
- Labor-intensive operations
- Narrow profit margins
- Higher employee counts to serve physical locations
Frequently Asked Questions About Revenue per Employee
What is a good revenue per employee ratio for my business?
A good ratio depends on your industry. For example, technology companies target around $300,000 or higher, while retail businesses aim closer to $150,000. Always compare your results to industry-specific benchmarks for meaningful insights.
How often should I calculate revenue per employee?
Calculate this metric quarterly or annually to track performance trends and guide strategic decisions related to hiring and resource management.
Should part-time employees be included?
Include part-time employees by converting them to full-time equivalents (FTEs). For example, two half-time employees count as one full-time employee.
How can this metric assist hiring decisions?
By tracking revenue per employee, you can decide whether adding staff will improve overall efficiency or strain resources. It helps maintain optimal staffing aligned with your revenue goals.
Does company size affect revenue per employee?
Yes, companies of different sizes may show varying revenue per employee due to scale effects and operational complexity. Always compare with similar-sized peers in your industry for an accurate assessment.
Important Disclaimer
The calculations, results, and content provided by our tools are not guaranteed to be accurate, complete, or reliable. Users are responsible for verifying and interpreting the results. Our content and tools may contain errors, biases, or inconsistencies. Do not enter personal data, sensitive information, or personally identifiable information in our web forms or tools. Such data entry violates our terms of service and may result in unauthorized disclosure to third parties. We reserve the right to save inputs and outputs from our tools for the purposes of error debugging, bias identification, and performance improvement. External companies providing AI models used in our tools may also save and process data in accordance with their own policies. By using our tools, you consent to this data collection and processing. We reserve the right to limit the usage of our tools based on current usability factors.