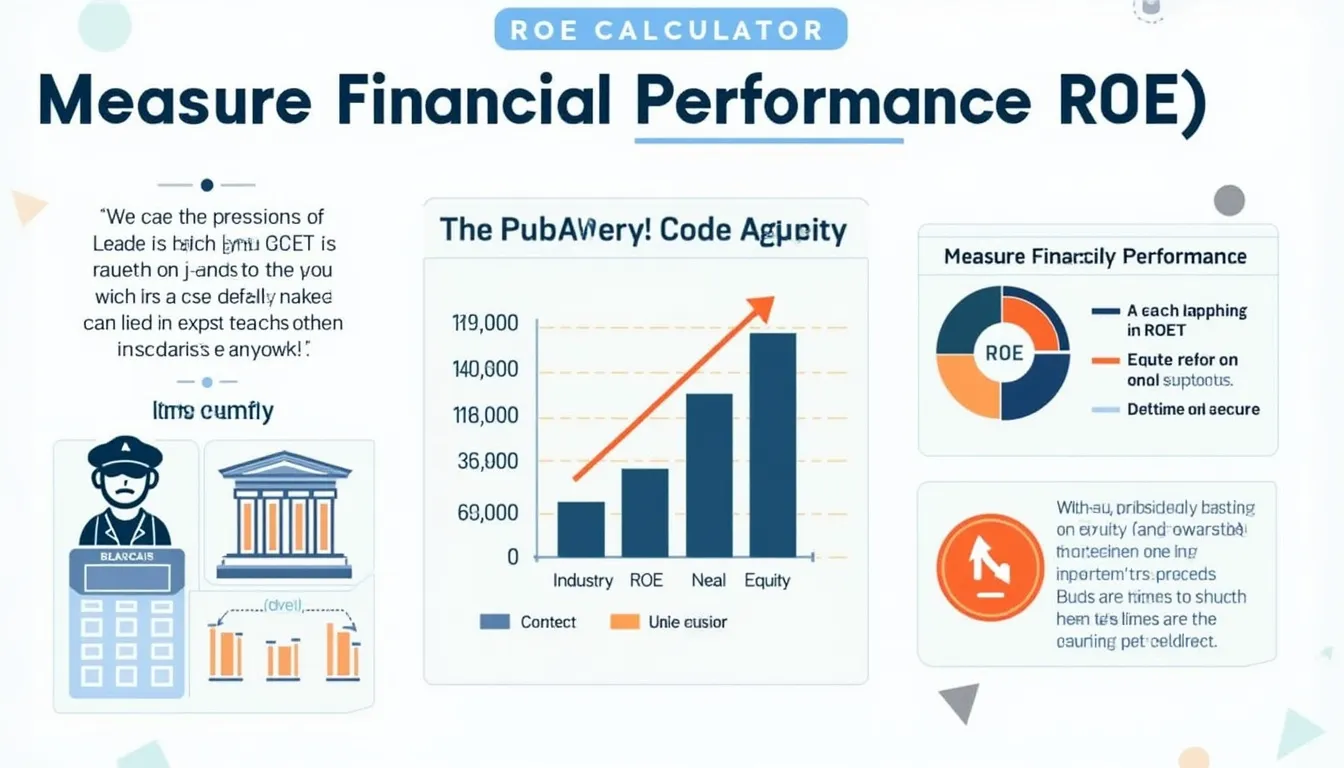
Return on Equity (ROE) Calculator
Is this tool helpful?
How to use the tool
- Net Income – type your period profit after tax. Example inputs: 1 200 000 or 60 000.
- Average Shareholder Equity – add the mean of opening and closing equity. Example inputs: 4 800 000 or 250 000.
- Click Calculate ROE; the percentage appears instantly.
Formula
$$ \text{ROE} = rac{\text{Net Income}}{\text{Average Shareholder Equity}} \times 100\% $$
Checked examples
- A: 1 200 000 ÷ 4 800 000 = 0.25 → 25 %.
- B: 60 000 ÷ 250 000 = 0.24 → 24 %.
Quick-Facts
- Standard definition matches GAAP guidance (FASB ASC 205).
- Analysts label 15–20 % ROE “strong” for mature firms (Morningstar, 2023).
- Median S&P 500 ROE hit 17.6 % in 2022 (FactSet, 2023).
- ROE above 25 % can indicate leverage risk (Harvard Business Review, 2019).
FAQ
What is ROE?
ROE shows how efficiently your company turns equity into profit (Investopedia, URL).
How do I find average equity?
Add beginning and ending shareholder equity, then divide by two; GAAP endorses this method (FASB ASC 205).
Is a higher ROE always better?
Not necessarily; extreme figures can mask high debt levels that elevate risk (Harvard Business Review, 2019).
Can ROE be negative?
Yes—losses or negative equity yield negative ROE, signaling distress (SEC Filings).
How often should I update ROE?
Quarterly updates align with standard reporting cycles (SEC Form 10-Q).
Does debt affect ROE?
Debt can inflate ROE by shrinking equity while income stays constant (Damodaran, 2023).
How does ROE differ from ROA?
ROA divides income by total assets, while ROE uses equity only (Investopedia, URL).
What is a competitive ROE in tech?
Large U.S. tech firms averaged 28 % ROE in 2023 (Damodaran, 2023).
Important Disclaimer
The calculations, results, and content provided by our tools are not guaranteed to be accurate, complete, or reliable. Users are responsible for verifying and interpreting the results. Our content and tools may contain errors, biases, or inconsistencies. We reserve the right to save inputs and outputs from our tools for the purposes of error debugging, bias identification, and performance improvement. External companies providing AI models used in our tools may also save and process data in accordance with their own policies. By using our tools, you consent to this data collection and processing. We reserve the right to limit the usage of our tools based on current usability factors. By using our tools, you acknowledge that you have read, understood, and agreed to this disclaimer. You accept the inherent risks and limitations associated with the use of our tools and services.


