Profitability Index Calculator
Is this tool helpful?
How to Use the Profitability Index Calculator Effectively
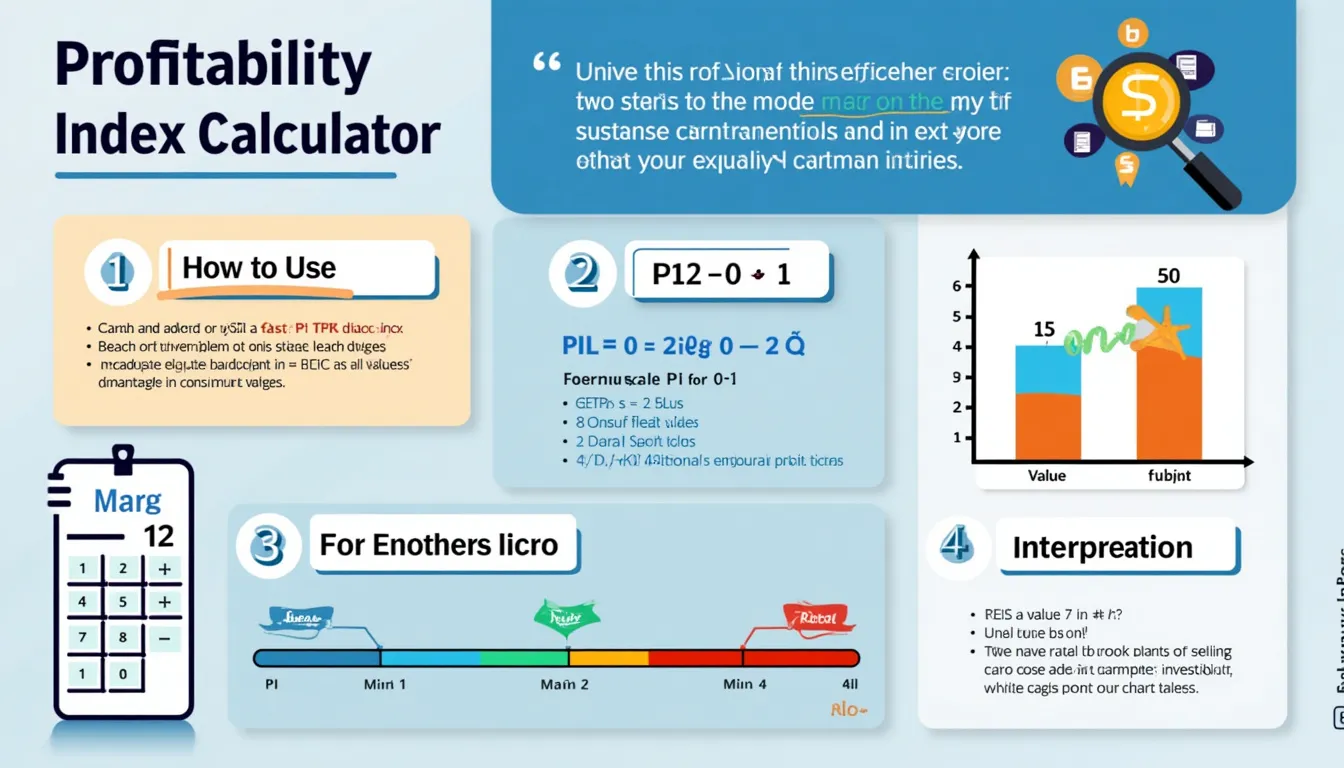
Our Profitability Index Calculator enables you to quickly evaluate the potential profitability of your investment projects with ease. Follow these simple steps to maximize the benefits of this powerful financial tool:
- Enter the Initial Investment Amount: Provide the total upfront cost of your project in USD. For example, you might enter 250000 or 450000.
- Input Annual Cash Flows: Enter the projected annual cash inflows for each year, separated by spaces. For instance, if expecting $12000 in year one, $18000 in year two, and $25000 in year three, enter “12000 18000 25000”. Alternatively, you could input “15000 15000 20000 20000” for a four-year project.
- Specify the Discount Rate (%): Provide the discount rate reflective of your investment’s risk and time value of money as a percentage. Examples include 7.5 for 7.5% or 15 for 15%.
- Calculate the Profitability Index: Click the “Calculate” button to compute your Profitability Index based on the entered values.
- Interpret the Result: The calculator will display the Profitability Index. A value greater than 1 indicates a potentially profitable investment, while less than 1 suggests it may not be financially viable.
Understanding the Profitability Index: Definition, Purpose, and Key Benefits
The Profitability Index (PI), sometimes called the Profit Investment Ratio or Value Investment Ratio, is a vital financial metric used to assess the attractiveness of investment projects. It is the ratio between the present value of future cash inflows and the initial investment, helping investors and businesses to make informed capital budgeting decisions.
By calculating the PI, you can determine whether a project adds value relative to its cost, assisting in prioritizing investment opportunities and ensuring efficient capital allocation.
Mathematical Formula for the Profitability Index
The Profitability Index is mathematically defined as:
$$ PI = \frac{\text{Present Value of Future Cash Flows}}{\text{Initial Investment}} $$
Where the present value of future cash flows is calculated by discounting each cash flow to the present using the discount rate. Expressed in detail:
$$ PI = \frac{\sum_{t=1}^{n} \frac{CF_t}{(1+r)^t}}{I_0} $$
- CFt: Cash flow in year t
- r: Discount rate (as a decimal)
- n: Total number of years
- I0: Initial investment amount
Key Benefits of Using the Profitability Index Calculator
- Effortless and Accurate Calculations: Eliminates manual computation errors and complex formula work.
- Supports Informed Investment Decisions: Helps identify projects likely to generate value over their costs.
- Easy Comparison Across Opportunities: Standardizes evaluation even when projects differ in scale or cash flow timing.
- Accounts for Time Value of Money and Risk: Incorporates discount rates reflecting investment risk and opportunity cost.
- Optimizes Capital Allocation: Assists businesses in prioritizing projects that maximize returns on limited resources.
- Enhances Long-Term Financial Planning: Provides insights into how investments perform over multiple years.
Example Calculations Demonstrating Practical Use
Example 1: Evaluating Two Software Licenses
Consider a company deciding between two software license purchases:
- License A:
- Initial Investment: $60,000
- Annual Cash Flows: $15,000 for 6 years
- Discount Rate: 9%
- License B:
- Initial Investment: $90,000
- Annual Cash Flows: $22,000 for 6 years
- Discount Rate: 9%
Using the calculator:
- License A Inputs: Initial Investment = 60000, Cash Flows = “15000 15000 15000 15000 15000 15000”, Discount Rate = 9
- Profitability Index Result: Approximately 1.14
- License B Inputs: Initial Investment = 90000, Cash Flows = “22000 22000 22000 22000 22000 22000”, Discount Rate = 9
- Profitability Index Result: Approximately 1.13
Both licenses appear similarly profitable, with PI values just above 1, indicating positive returns relative to cost.
Example 2: Assessing a Boutique Hotel Investment
An investor evaluates a boutique hotel purchase with the following projections:
- Initial Investment: $1,000,000
- Annual Cash Flows (after expenses):
- Year 1: $85,000
- Year 2: $90,000
- Year 3: $95,000
- Year 4: $100,000
- Year 5: $1,150,000 (includes expected sale price)
- Discount Rate: 10%
Inputs for the calculator:
- Initial Investment = 1000000
- Annual Cash Flows = “85000 90000 95000 100000 1150000”
- Discount Rate = 10
Profitability Index Result: Approximately 1.18, indicating the investment may generate an 18% return above the initial cost when accounting for present value.
Example 3: Analyzing a Renewable Energy Project
A startup plans a solar panel installation project with:
- Initial Investment: $400,000
- Projected Cash Flows:
- Year 1: -$20,000 (initial operational losses)
- Year 2: $60,000
- Year 3: $100,000
- Year 4: $140,000
- Year 5: $180,000
- Discount Rate: 11%
Entering these values:
- Initial Investment = 400000
- Annual Cash Flows = “-20000 60000 100000 140000 180000”
- Discount Rate = 11
Calculated Profitability Index: Approximately 1.21, suggesting this renewable energy project has a profitable outlook after factoring in risks and time value.
Why Use the Profitability Index Calculator? Addressing Key Investment Challenges
Simplifies Complex Financial Workflows
Manual PI calculations with multiple cash flows can be error-prone and time-intensive. This calculator automates the process, instantly delivering precise results to help you focus on strategic analysis.
Facilitates Objective Investment Comparisons
With standardized PI values, it’s easier to compare investments varying widely in size and cash flow schedules, promoting data-driven prioritization.
Incorporates Time Value of Money and Risk
By applying customizable discount rates, the calculator accounts for both the time value of money and investment risk, ensuring a realistic profitability assessment.
Optimizes Business Capital Allocation
Companies can strategically rank projects, allocating scarce capital to the highest-value opportunities, improving overall financial performance.
Frequently Asked Questions About the Profitability Index Calculator
1. What insights does the Profitability Index provide?
It measures how much value an investment is expected to generate relative to its cost. A PI greater than 1 indicates added value; below 1 signals a potential loss.
2. How does the Profitability Index differ from Net Present Value (NPV)?
While NPV gives an absolute profit figure in dollars, PI expresses profitability as a ratio, allowing better comparison across projects of varying sizes.
3. What Profitability Index indicates a ‘good’ investment?
Generally, PI values above 1 are favorable. Some investors prefer thresholds like 1.2 or 1.3 to ensure a safety margin.
4. Can the Profitability Index ever be negative?
No. The lowest value is 0, which occurs if future cash flows have zero present value. PI ranges from 0 upwards.
5. How does the discount rate affect the Profitability Index?
Higher discount rates reduce the present value of future cash flows, lowering the PI. Conversely, lower rates increase PI.
6. Is the Profitability Index useful for projects with different durations?
Yes. It standardizes profitability across projects of varying lengths, provided discount rates and risk profiles are appropriately adjusted.
7. Should I rely solely on Profitability Index for investment decisions?
PI is a valuable measure but should complement other tools like NPV, IRR, and payback period. Qualitative factors also matter for comprehensive evaluation.
Conclusion: Empower Your Financial Decisions with the Profitability Index Calculator
Our Profitability Index Calculator is an essential resource for investors, financial analysts, and business leaders looking to assess investment potential swiftly and accurately. By quantifying the relationship between future cash inflows and initial costs, it assists in making confident, well-informed capital allocation decisions.
- Fast and precise profitability assessments without complex manual computations
- Easy comparison of diverse investment projects
- Incorporation of risk and time value of money through discount rates
- Support for strategic capital budgeting and resource prioritization
- Enhanced insights for long-term financial planning
Whether evaluating business ventures, real estate opportunities, or technology investments, leverage this calculator to gain clarity on the financial viability of your projects and drive smarter investment choices.
Important Disclaimer
The calculations, results, and content provided by our tools are not guaranteed to be accurate, complete, or reliable. Users are responsible for verifying and interpreting the results. Our content and tools may contain errors, biases, or inconsistencies. Do not enter personal data, sensitive information, or personally identifiable information in our web forms or tools. Such data entry violates our terms of service and may result in unauthorized disclosure to third parties. We reserve the right to save inputs and outputs from our tools for the purposes of error debugging, bias identification, and performance improvement. External companies providing AI models used in our tools may also save and process data in accordance with their own policies. By using our tools, you consent to this data collection and processing. We reserve the right to limit the usage of our tools based on current usability factors.


