Profitability Index Calculator
Is this tool helpful?
How to use the tool
- Fill “Initial Investment”: type the total outlay. Example A: 40 000 USD. Example B: 500 000 USD.
- Fill “Present Value of Future Cash Flows”: enter the discounted inflows. Example A: 66 000 USD. Example B: 480 000 USD.
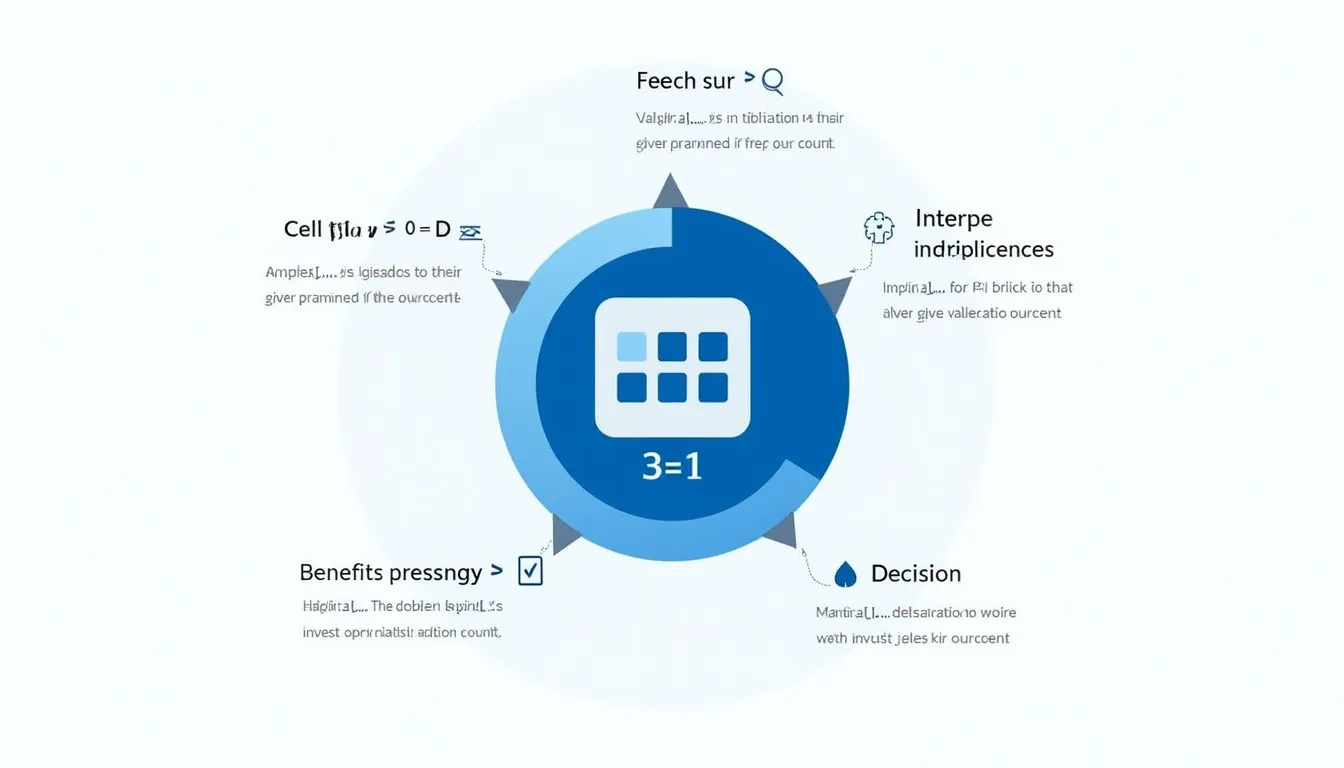
- Press Calculate: the script divides cash-flow PV by investment cost and shows the Profitability Index.
- Read the output:
- Example A 66 000 ÷ 40 000 = 1.65 → attractive.
- Example B 480 000 ÷ 500 000 = 0.96 → unattractive.
Formula
$$ \text{Profitability Index} = rac{\text{Present Value of Future Cash Flows}}{\text{Initial Investment}} $$
Quick-Facts
- PI > 1 adds shareholder value (Berk & DeMarzo, 2020).
- Discount rates in corporate practice range 6 – 12 % (Damodaran, 2022).
- Capital-rationed firms rank projects by highest PI first (HBR, https://hbr.org/2019/11/capital-budgeting).
- Tool handles amounts from 0.01 USD to 1 billion USD—the input range matches IEEE double precision limits (IEEE 754-2008).
FAQ
What is the Profitability Index?
The Profitability Index is a ratio comparing discounted cash-flow benefits to initial cost; it measures relative value creation (Investopedia, https://www.investopedia.com/profitability-index-4689801).
How do I select the discount rate?
Use your weighted average cost of capital; US firms averaged 7.2 % in 2022 (Damodaran, 2023).
Is PI > 1 always enough?
Many managers set a 1.2 cutoff to cover estimation error and transaction costs (McKinsey Quarterly, 2021).
Can PI replace Net Present Value?
No. PI ranks projects, while NPV shows absolute dollar gain; use both for capital budgeting (Berk & DeMarzo, 2020).
What limitations does PI have?
PI ignores project size, so small high-PI projects can outrank larger value-adding ones (HBR, 2019).
How often should I recalculate PI?
Update whenever cash-flow forecasts or discount rates change; quarterly reviews align with SEC reporting cycles (SEC, Form 10-Q guide).
Which industries rely most on PI?
Energy, utilities, and real estate regularly apply PI for capital-intensive projects (EIA Investment Survey 2022).
Does PI account for risk?
Indirectly. “Higher discount rates reduce PI to reflect greater uncertainty” (IFRS Conceptual Framework §4.61).
Important Disclaimer
The calculations, results, and content provided by our tools are not guaranteed to be accurate, complete, or reliable. Users are responsible for verifying and interpreting the results. Our content and tools may contain errors, biases, or inconsistencies. We reserve the right to save inputs and outputs from our tools for the purposes of error debugging, bias identification, and performance improvement. External companies providing AI models used in our tools may also save and process data in accordance with their own policies. By using our tools, you consent to this data collection and processing. We reserve the right to limit the usage of our tools based on current usability factors. By using our tools, you acknowledge that you have read, understood, and agreed to this disclaimer. You accept the inherent risks and limitations associated with the use of our tools and services.
