Product-Market Fit Score Calculator
Is this tool helpful?
How to Use the Product-Market Fit Score Calculator Effectively
Use this Product-Market Fit Score Calculator to understand how well your product meets market demand. Follow these simple steps to get accurate insights:
- Enter Total Survey Responses: Input the total number of survey participants. For example, if 420 customers completed your survey, enter 420. Alternatively, if you surveyed 780 users, input 780.
- Input “Very Disappointed” Responses: Enter the count of users who would be very disappointed if they lost access to your product. For example, if 168 respondents expressed this feeling, enter 168. Another example could be 312 very disappointed users.
- Add “Somewhat Disappointed” Responses (Optional): Provide the number of users who would be somewhat disappointed. If you have 120 of these responses, enter 120. Otherwise, you may enter 250.
- Include “Not Disappointed” Responses (Optional): Enter the number of users who wouldn’t be disappointed. For example, enter 90 or 150.
- Specify “No Longer Use” Responses (Optional): Input how many respondents no longer use your product. For instance, 42 or 58 users may fall under this category.
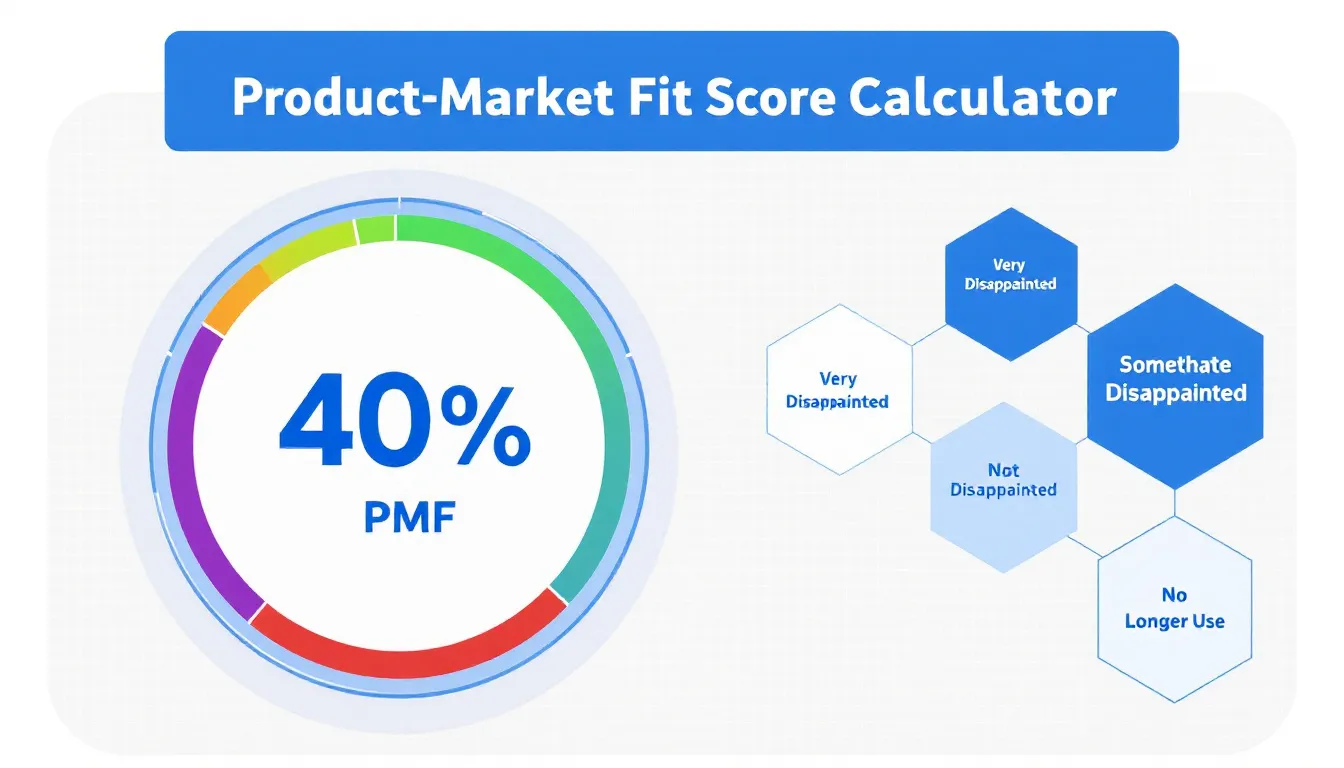
- Calculate the Score: Click the calculate button to generate your Product-Market Fit Score, status, and a detailed distribution chart of your survey responses.
The results will give you a clear picture of your product’s position in the market and highlight areas needing attention.
Understanding the Product-Market Fit Score Calculator
The Product-Market Fit Score Calculator measures how indispensable your product is to your users, helping you evaluate its success in meeting market needs. It accomplishes this by quantifying user sentiment from survey data, giving you both a numeric score and qualitative status.
This tool is valuable for entrepreneurs, product managers, and marketing teams who want to gauge product traction through customer feedback and make data-driven decisions to improve product development and user satisfaction.
What Is Product-Market Fit?
Product-Market Fit (PMF) occurs when your product successfully satisfies a substantial market demand. It’s a key milestone that signals your product resonates well with your target customers and fulfills a real need effectively.
How Does the Calculator Work?
This calculator is based on the widely used Sean Ellis Test. The core survey question is:
“How would you feel if you could no longer use [Product Name]?”
Respondents select their feelings from four options:
- Very disappointed
- Somewhat disappointed
- Not disappointed
- I no longer use the product
Your Product-Market Fit Score is the percentage of users who say they would be very disappointed, indicating how many find your product indispensable.
Product-Market Fit Score Formula
The PMF Score uses this formula:
$$ \text{Product-Market Fit Score} = \frac{\text{Number of “Very Disappointed” Responses}}{\text{Total Number of Survey Responses}} \times 100\% $$Achieving a score of 40% or higher is typically recognized as reaching product-market fit, as suggested by Sean Ellis. This score offers a clear benchmark to evaluate your product’s market acceptance.
Example Calculations Using the Product-Market Fit Score Calculator
Example 1: Mobile Health App
A startup surveyed 600 users of their health tracking app with these results:
- Very Disappointed: 270
- Somewhat Disappointed: 140
- Not Disappointed: 150
- No Longer Use: 40
Calculate the PMF Score:
$$ \text{PMF Score} = \frac{270}{600} \times 100\% = 45\% $$With 45%, this app has achieved product-market fit, indicating a strong core user base that values it highly.
Example 2: Online Learning Platform
An online education company surveyed 800 users on a new feature:
- Very Disappointed: 200
- Somewhat Disappointed: 300
- Not Disappointed: 250
- No Longer Use: 50
Their PMF Score calculates as follows:
$$ \text{PMF Score} = \frac{200}{800} \times 100\% = 25\% $$At 25%, the product hasn’t reached product-market fit. The company should explore feedback from the “Somewhat Disappointed” group to improve and increase user engagement.
Benefits of Using the Product-Market Fit Score Calculator
1. Clear, Quantifiable Insights
The calculator turns subjective user opinions into a precise score, allowing you to track product traction over time and across product versions.
2. Defined Success Benchmark
With a 40% threshold, you get a straightforward target that aligns teams and guides priorities toward achieving market fit.
3. Data-Driven Decisions
Use your PMF Score to make informed choices about where to focus product development, marketing, and resource allocation.
4. Early Warning System for User Satisfaction
Regular assessments alert you to drops in satisfaction or retention, enabling timely adjustments.
5. Useful for Investor Communication
A strong PMF Score provides evidence-based traction metrics that help gain investor confidence.
Practical Applications of the Product-Market Fit Score Calculator
Assessing Product Adoption Across Market Segments
Calculate PMF Scores for different user segments based on demographics, geography, or usage patterns. This reveals which groups highly value your product, enabling better-targeted marketing and product improvements.
Prioritizing Product Features
Focus development on features that increase the “very disappointed” portion of your users. This helps strengthen product value and market fit.
Monitoring Impact of Product Updates
After releasing new features or changes, run fresh PMF surveys to track how updates affect user satisfaction and market fit over time.
Frequently Asked Questions (FAQ)
How often should I calculate my Product-Market Fit Score?
Calculate your PMF Score regularly, especially after key product updates or market shifts. For new products, monthly or quarterly evaluations give helpful progress insights.
What should I do if my score is below 40%?
Scores under 40% indicate that your product hasn’t reached strong market fit yet. Use customer feedback to identify pain points or missing features and improve your product accordingly.
Can I use this tool for physical products?
Yes. Tailor the survey question for physical products — for example, “How disappointed would you be if you could no longer buy [Product Name]?” — and then use the calculator to assess fit.
How many survey responses do I need for accurate results?
While larger samples provide better reliability, meaningful insights can start with 30-40 responses. For more precise analysis, aim for at least 100 responses.
Is a higher PMF Score always better?
Generally, yes, but extremely high scores may reflect niche markets. Balance a strong PMF Score with growth potential for broader success.
Does the “No Longer Use” category affect the PMF Score?
No. The PMF Score depends solely on the percentage of “very disappointed” users. However, a high number of “no longer use” responses flags retention issues that merit separate attention.
By using this Product-Market Fit Score Calculator regularly, you gain a clear understanding of how your product resonates with users, enabling you to improve your market strategy and product development with confidence.
Important Disclaimer
The calculations, results, and content provided by our tools are not guaranteed to be accurate, complete, or reliable. Users are responsible for verifying and interpreting the results. Our content and tools may contain errors, biases, or inconsistencies. Do not enter personal data, sensitive information, or personally identifiable information in our web forms or tools. Such data entry violates our terms of service and may result in unauthorized disclosure to third parties. We reserve the right to save inputs and outputs from our tools for the purposes of error debugging, bias identification, and performance improvement. External companies providing AI models used in our tools may also save and process data in accordance with their own policies. By using our tools, you consent to this data collection and processing. We reserve the right to limit the usage of our tools based on current usability factors.