Price to Dividend Ratio Calculator
Is this tool helpful?
How to use the tool
- Type the current price per share. Example inputs: 67.80 USD or 150.40 USD.
- Add the annual dividends per share. Example inputs: 2.10 USD or 5.25 USD.
- Press “Calculate.” The ratio appears, rounded to two decimals.
- Read the result. A lower number means you pay less for each dividend dollar.
Formula
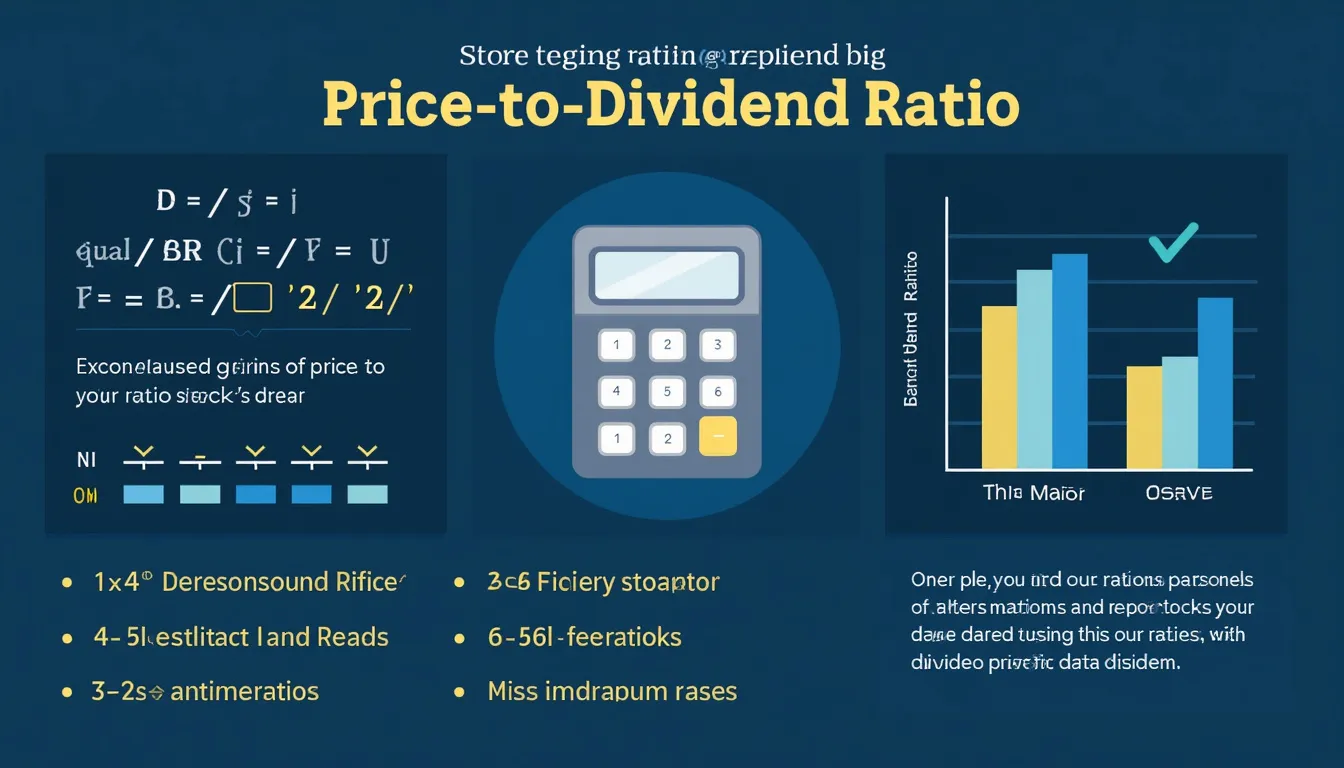
$$\text{Price-to-Dividend Ratio}= rac{\text{Price Per Share}}{\text{Dividends Per Share}}$$
Example calculations
- Example 1: 67.80 ÷ 2.10 = 32.29 years.
- Example 2: 150.40 ÷ 5.25 = 28.66 years.
Quick-Facts
- The ratio is the inverse of dividend yield (Investopedia, 2024).
- NYSE issuers must disclose dividend actions promptly (NYSE Manual §204.12).
- Average S&P 500 dividend yield: 1.55 % in 2023 (S&P Global, 2024).
- Ratios above 30 flag low yields (Morningstar Equity Handbook, 2024).
- “Dividend growth that outpaces inflation is a sign of strength” (CFA Institute, 2023).
FAQ
What is the Price-to-Dividend Ratio?
The ratio shows how many years of current dividends equal today’s share price, highlighting payout efficiency (Investopedia, 2024).
How do I interpret a high ratio?
A high figure signals low dividend yield; investors may face slower cash-back from dividends (Morningstar Equity Handbook, 2024).
Is it the same as dividend yield?
No. Dividend yield equals dividends ÷ price, while this ratio flips that relationship—price ÷ dividends (Investopedia, 2024).
Can I compare ratios across sectors?
Yes. Use the metric to spot higher-yield utilities versus lower-yield tech stocks, adjusting for industry norms (CFA Institute, 2023).
Why must dividends per share be above zero?
Division by zero is undefined and firms paying nothing provide no income stream, rendering the ratio meaningless (SEC Staff Accounting Bulletin 110).
How often should I recalculate?
Update after each quarterly dividend announcement or significant price move to keep valuations current (NYSE Manual §204.12).
Do buybacks affect the ratio?
Repurchases reduce shares outstanding but not the dividend amount per share immediately, so the ratio stays unchanged short-term (Federal Reserve FRED, 2024).
Can I use different currencies?
Yes—enter price and dividend in the same currency to maintain consistency; the math is currency-agnostic (OECD Exchange Rate Guide, 2024).
Important Disclaimer
The calculations, results, and content provided by our tools are not guaranteed to be accurate, complete, or reliable. Users are responsible for verifying and interpreting the results. Our content and tools may contain errors, biases, or inconsistencies. Do not enter personal data, sensitive information, or personally identifiable information in our web forms or tools. Such data entry violates our terms of service and may result in unauthorized disclosure to third parties. We reserve the right to save inputs and outputs from our tools for the purposes of error debugging, bias identification, and performance improvement. External companies providing AI models used in our tools may also save and process data in accordance with their own policies. By using our tools, you consent to this data collection and processing. We reserve the right to limit the usage of our tools based on current usability factors.
