Present Value of Stock Calculator
Is this tool helpful?
How to use the tool
- Enter Dividends ($): Type the expected payment per period.
Example A: 2.40 Example B: 0.40 - Enter Required Return (%): Key in the minimum annual return you demand.
Example A: 6.8 Example B: 3.6 - Press “Calculate”. The tool divides dividend by return and shows the intrinsic price.
Formula the calculator applies
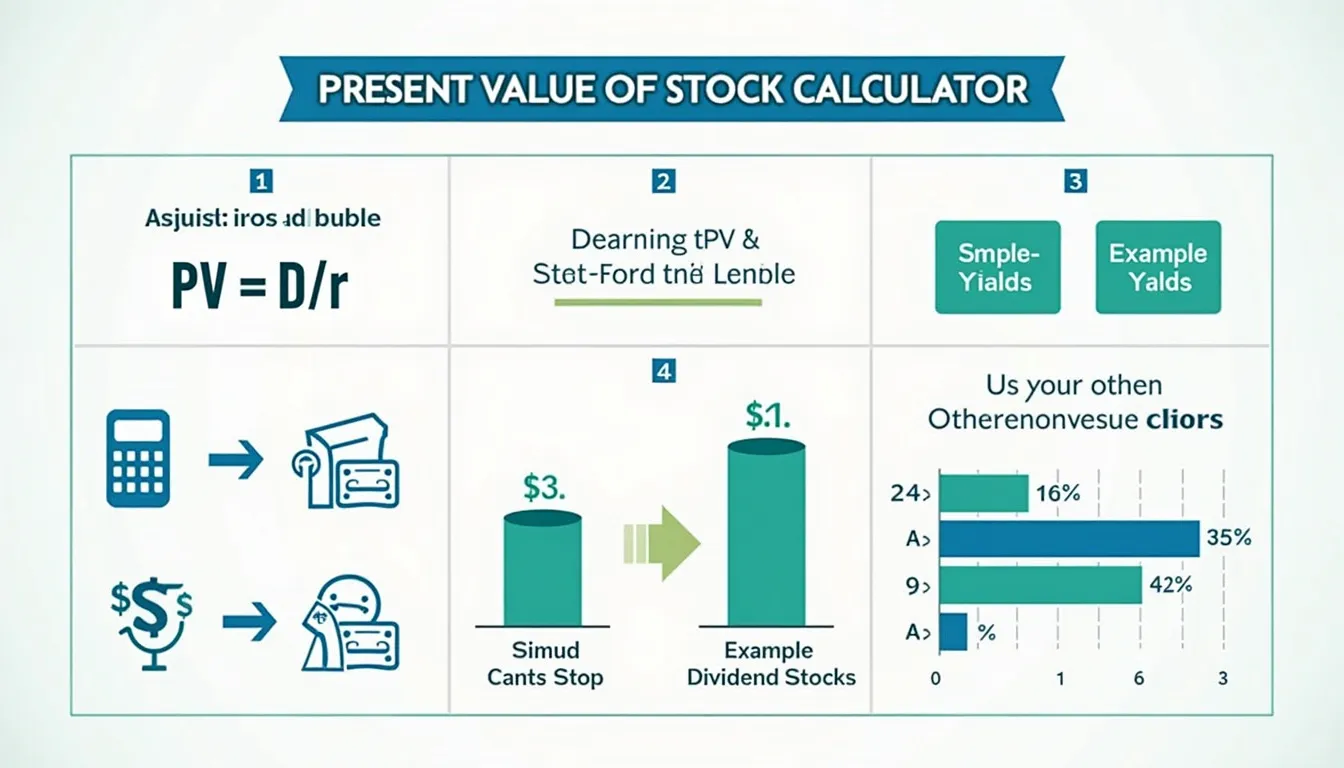
Zero-growth Dividend Discount Model:
$$ PV = rac{D}{r} $$- D = constant dividend per period
- r = required rate of return (decimal)
Worked examples
- Example A: D = $2.40, r = 0.068 ⇒ PV = $35.29 (2.40 / 0.068).
- Example B: D = $0.40, r = 0.036 ⇒ PV = $11.11 (0.40 / 0.036).
Quick-Facts
- Model assumes zero dividend growth—best for mature or preferred shares (Investopedia, https://www.investopedia.com/terms/d/dividenddiscountmodel.asp).
- Typical required return for U.S. equities lies between 6 % and 12 % (Damodaran, 2023 data table).
- Average S&P 500 dividend payout ratio is 35 % of earnings (S&P Global Market Intelligence, 2023).
- SEC reminds investors that companies can suspend dividends at any time (SEC Investor Bulletin, https://www.sec.gov/files/ib_dividends.pdf).
FAQ
What does this calculator deliver?
It shows the present value per share when dividends stay constant, letting you judge if the market price is high or low (Investopedia, dividenddiscountmodel.asp).
How does the zero-growth model work?
The model treats a stock like a perpetuity: price equals dividend divided by required return. It ignores future dividend changes, simplifying valuation (Brealey & Myers, 2020).
When should you use a zero-growth estimate?
Use it for utilities, REITs, or preferred shares that pay fixed dividends and rarely change policy (Morningstar Utilities Report 2022).
Why divide by a decimal, not a percentage?
The formula uses the return rate as a fraction of 1. Convert 7 % to 0.07 before dividing to avoid a 100-fold error (Corporate Finance Institute, Zero Growth DDM).
What drives the required return input?
You base it on the risk-free rate plus a risk premium. Analysts add 3-6 % over U.S. Treasuries for large caps (Damodaran, 2023 Equity Risk Premium).
How sensitive is valuation to the return figure?
A one-point increase in required return cuts the zero-growth price about 14 % for an 8 % baseline—“a small change, big impact” (Brealey & Myers, 2020).
Does the model include capital gains?
No. It values only dividend income. Price appreciation requires a growth-based model like Gordon Growth (Graham & Dodd, Security Analysis).
How can you stress-test results?
Run multiple scenarios: raise dividends, vary the return, and compare outputs. Scenario analysis clarifies how robust your investment thesis is (CFA Institute, 2022 curriculum).
Important Disclaimer
The calculations, results, and content provided by our tools are not guaranteed to be accurate, complete, or reliable. Users are responsible for verifying and interpreting the results. Our content and tools may contain errors, biases, or inconsistencies. Do not enter personal data, sensitive information, or personally identifiable information in our web forms or tools. Such data entry violates our terms of service and may result in unauthorized disclosure to third parties. We reserve the right to save inputs and outputs from our tools for the purposes of error debugging, bias identification, and performance improvement. External companies providing AI models used in our tools may also save and process data in accordance with their own policies. By using our tools, you consent to this data collection and processing. We reserve the right to limit the usage of our tools based on current usability factors.