PEG Ratio Calculator
Is this tool helpful?
How to use the tool
- Price/Earnings (P/E) Ratio: Type the current multiple. Example inputs: 22.7 or 31.9.
- Earnings-Growth Rate (%): Enter the forward annual estimate. Example inputs: 15.8 or 5.2.
- Press “Calculate”; the tool returns the PEG ratio to two decimals and labels it undervalued, fair, or overvalued.
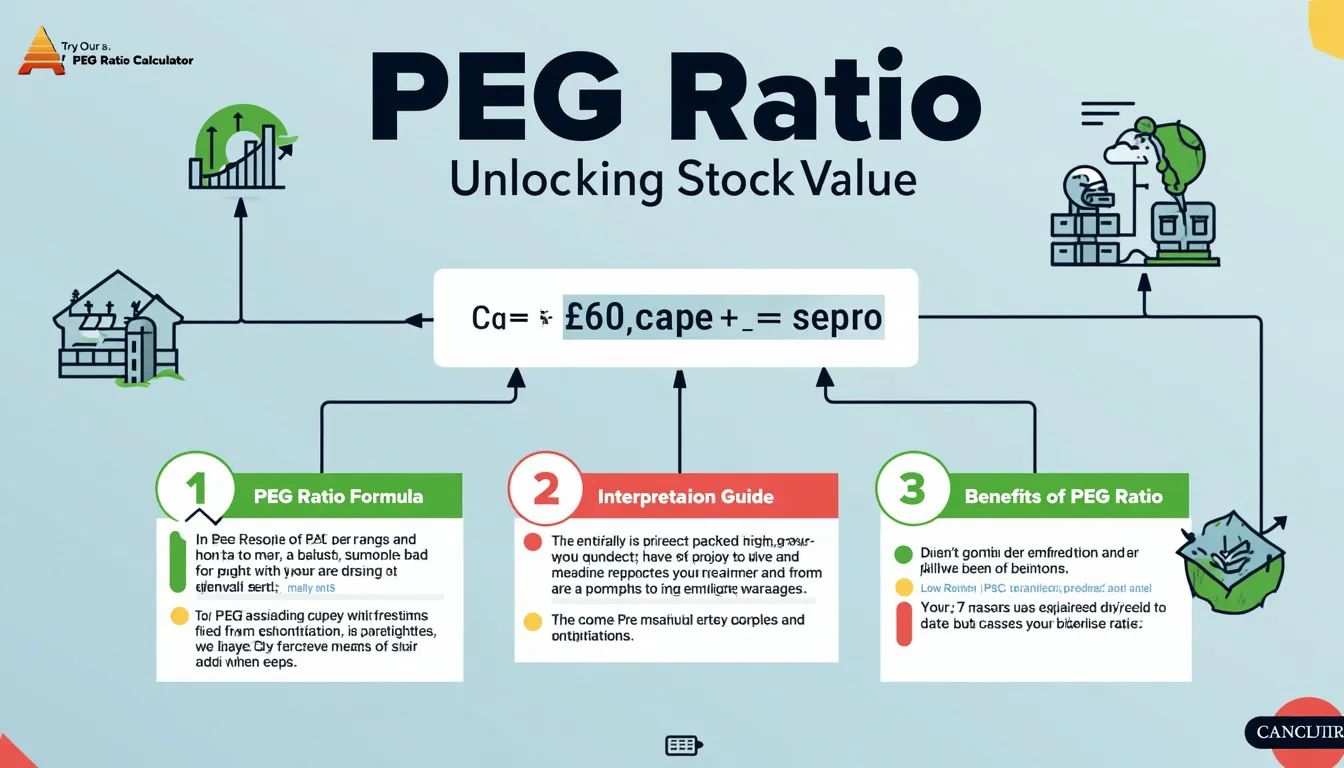
Formula
Mathematically,
$$PEG = rac{P/E}{g}$$
where P/E is the price-to-earnings ratio and g is the expected annual earnings-growth rate (percentage).
Example calculations
- Example A: P/E = 22.7, g = 15.8%. $$PEG = rac{22.7}{15.8} = 1.44$$ PEG 1.44 → slightly overvalued.
- Example B: P/E = 31.9, g = 5.2%. $$PEG = rac{31.9}{5.2} = 6.13$$ PEG 6.13 → strongly overvalued.
- Example C: P/E = 40, g = 18%. $$PEG = rac{40}{18} = 2.22$$ PEG 2.22 → overvalued.
Quick-Facts
- PEG ≈ 1 denotes fair value (Investopedia, https://www.investopedia.com/terms/p/pegratio.asp).
- Consensus growth estimates usually cover 3-5 years (Morningstar Methodology, https://www.morningstar.com).
- S&P 500 average P/E was 24.1 in 2023 (S&P Global, 2024).
- A study found PEG<1 portfolios beat the market by 3.4 % annually from 1981-2020 (Damodaran, NYU, 2021).
FAQs
What is the PEG ratio?
The PEG ratio compares a stock’s P/E to its expected earnings growth, balancing price with future prospects (Investopedia, https://www.investopedia.com).
How do I calculate PEG?
Divide the current P/E by the forward growth rate expressed as a whole number; use $$PEG = rac{P/E}{g}$$.
Why use PEG instead of P/E alone?
P/E ignores growth; PEG normalises valuation so high-growth firms are not penalised unfairly (CFA Institute, 2023).
What PEG values flag undervaluation?
Values below 1 suggest the stock trades below its growth-adjusted fair price (Securities Institute, 2022).
Where can I find reliable growth rates?
Use analyst consensus on platforms like FactSet or Morningstar; they update quarterly (Morningstar, 2024).
Can PEG turn negative?
Yes. Negative earnings or negative growth yield a negative PEG, signalling instability and requiring deeper analysis (SEC Filings, 2023).
Is PEG equally useful across sectors?
High-growth tech shows meaningful PEG spreads; utility stocks with slow growth offer limited PEG insight (McKinsey Valuation, 2020).
How often should I recalculate PEG?
Update after each quarterly earnings release to reflect new P/E and revised growth forecasts (FactSet, 2024).
Important Disclaimer
The calculations, results, and content provided by our tools are not guaranteed to be accurate, complete, or reliable. Users are responsible for verifying and interpreting the results. Our content and tools may contain errors, biases, or inconsistencies. Do not enter personal data, sensitive information, or personally identifiable information in our web forms or tools. Such data entry violates our terms of service and may result in unauthorized disclosure to third parties. We reserve the right to save inputs and outputs from our tools for the purposes of error debugging, bias identification, and performance improvement. External companies providing AI models used in our tools may also save and process data in accordance with their own policies. By using our tools, you consent to this data collection and processing. We reserve the right to limit the usage of our tools based on current usability factors.
