Partnership Map Generator
Is this tool helpful?
How to Use the Partnership Map and Collaboration Framework Generator Effectively
Step-by-Step Instructions
Follow these steps to create a clear and insightful partnership map and collaboration framework for your grant proposals or project plans:
-
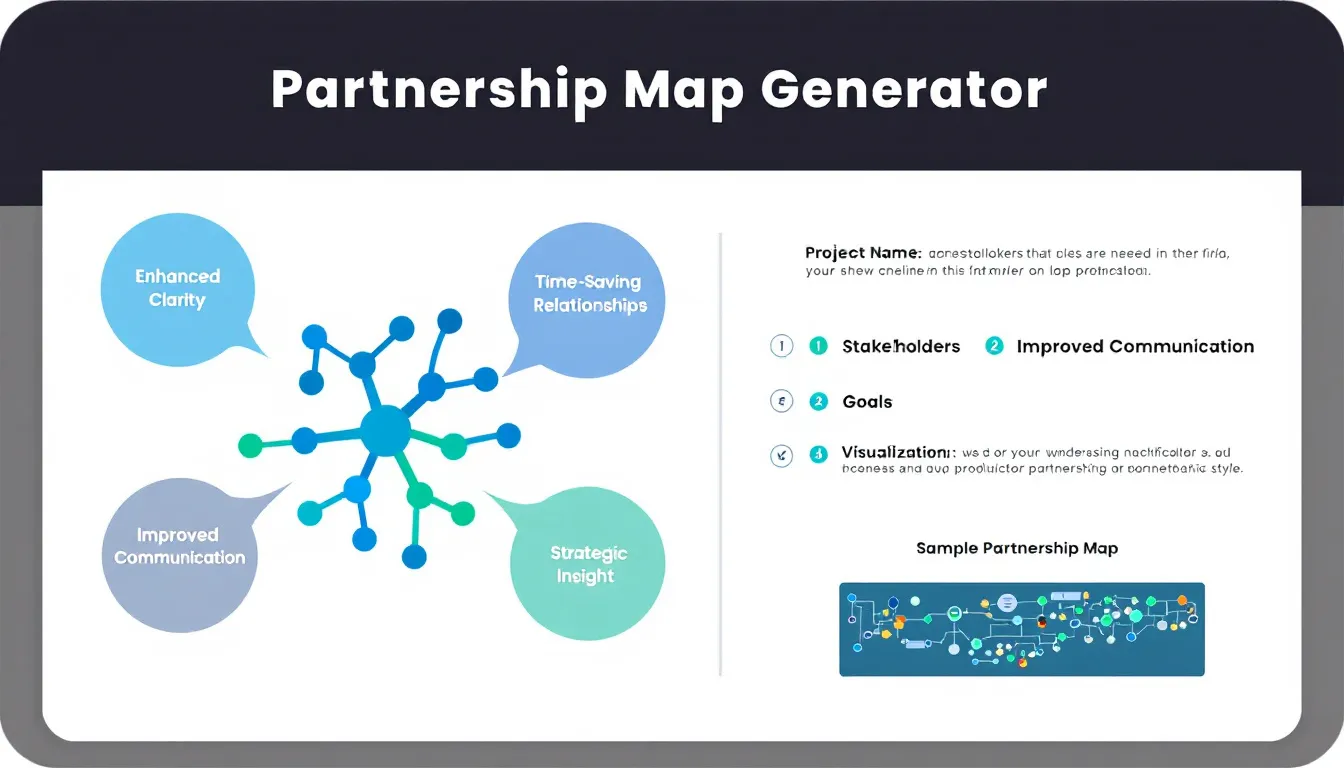
Name of Your Project or Grant Proposal: Enter a clear, descriptive name for your initiative.
- Example 1: “Neighborhood Youth Empowerment Program”
- Example 2: “Renewable Energy Adoption Project”
-
List of Key Stakeholders: Identify all individuals, organizations, or groups involved in your project.
- Example 1: “Local Libraries, Youth Centers, City Council, Volunteer Groups”
- Example 2: “Solar Panel Manufacturers, Environmental Agencies, Utility Companies”
-
Description of Relationships Between Stakeholders: Detail how these stakeholders interact or support each other.
- Example 1: “City Council funds Youth Centers, Libraries host workshops run by Volunteer Groups”
- Example 2: “Environmental Agencies provide guidelines to Solar Manufacturers, Utility Companies purchase energy from manufacturers”
-
Main Goals or Objectives (Optional): Specify your project’s primary aims to contextualize the partnership map.
- Example 1: “Increase youth engagement in community services by 30% within two years”
- Example 2: “Boost renewable energy usage by 25% citywide by 2026”
-
Preferred Visualization Style (Optional): Choose how you want the partnership map displayed.
- Example 1: “Force-directed network graph”
- Example 2: “Hierarchical flowchart”
- Generate the Map: Click the button to create your customized partnership map and collaboration framework visualization.
Introduction to the Partnership Map and Collaboration Framework Generator
What This Tool Does
This tool helps you create visual maps that display the relationships and collaborations between multiple stakeholders in your projects or grant proposals. It turns complex partnership details into easy-to-understand diagrams that highlight roles, connections, and interactions among participants.
Purpose and Benefits
- Clarifies Complex Networks: Visualize intricate stakeholder connections in a straightforward format.
- Saves Time: Generate professional partnership maps quickly without needing design skills.
- Improves Communication: Use visual frameworks to explain project dynamics to funders and teams.
- Supports Strategic Planning: Identify key partners, collaboration gaps, and opportunities.
- Customizable Visuals: Tailor maps to fit your project’s unique structure and presentation style.
Practical Uses of the Partnership Map Generator
1. Grant Proposal Enhancement
Create a detailed partnership map to demonstrate thoughtful planning and collaboration in your grant applications. For example, a literacy program can map relationships among schools, libraries, local businesses, and volunteer organizations to explain resource flows and joint activities clearly.
2. Project Planning and Stakeholder Management
Use the tool to analyze existing partnerships, identify missing links, and prepare for future collaboration. This helps you manage partnerships more effectively by visualizing influence, communication channels, and joint responsibilities.
3. Communication Tool for Teams and Partners
Share partnership maps during meetings or presentations to provide a clear overview of your project’s structure and collaboration framework, making discussions more productive and focused.
Understanding Stakeholder Influence Through Network Analysis
Quantifying Relationships with Graph Theory
The generator uses mathematical concepts from network analysis to measure stakeholder importance and influence within your project’s ecosystem. One important metric is betweenness centrality, which identifies stakeholders acting as bridges between others.
The formula for betweenness centrality is:
Where $$\sigma_{st}$$ is the total number of shortest paths from node s to node t, and $$\sigma_{st}(v)$$ is the number of those paths passing through node v. This helps you identify critical partners who connect different groups or sectors in your project.
Visualizing Influence
The tool can highlight influential stakeholders by adjusting node size or color based on these network metrics, helping you focus communication and resource allocation efficiently.
Handling Dynamic Partnerships Over Time
Your project’s partnerships may evolve. This tool lets you track and visualize those changes by entering time-based relationship data. For instance, create maps showing collaboration growth or shifts during different project phases, providing a timeline of partnerships to present to funders or internal teams.
Common Applications and Example Scenarios
Public Health Campaign
Visualize a network involving hospitals, clinics, community groups, and funding agencies. Highlight funding flows, service partnerships, and communication lines to strengthen your project narrative.
Multi-Institution Research Collaboration
Demonstrate how universities, research centers, and industry partners collaborate, identifying lead roles, shared resources, and data exchange.
Urban Development Project
Map connections between city planners, neighborhood associations, local businesses, and environmental groups, helping clarify stakeholder engagement strategy and project governance.
Frequently Asked Questions
Can I customize the map’s appearance?
Yes, customize layout options such as network graphs, hierarchical trees, or matrix views, as well as color schemes and node sizes to reflect stakeholder importance.
Is there a limit to how many stakeholders I can add?
The tool supports small and large networks, but for projects with over 50 stakeholders, consider creating multiple maps focusing on different aspects to keep visuals clear.
Can I export my partnership map?
Yes, export maps as high-resolution images or scalable vector graphics (SVG) for easy inclusion in proposals and presentations.
Can I update the map as my project changes?
You can save and edit your data to keep partnership maps current as collaborations evolve over time.
Is this tool useful beyond grant proposals?
Absolutely. Use it for internal project management to monitor partnerships, plan communication strategies, and analyze stakeholder roles throughout your project lifecycle.
Conclusion
The Partnership Map and Collaboration Framework Generator helps you visualize complex networks, improving your grant proposals and project management. By clarifying stakeholder roles and relationships, you strengthen communication and planning. Use this tool to create tailored, insightful visuals that showcase your project’s collaboration landscape clearly and effectively.
Important Disclaimer
The calculations, results, and content provided by our tools are not guaranteed to be accurate, complete, or reliable. Users are responsible for verifying and interpreting the results. Our content and tools may contain errors, biases, or inconsistencies. Do not enter personal data, sensitive information, or personally identifiable information in our web forms or tools. Such data entry violates our terms of service and may result in unauthorized disclosure to third parties. We reserve the right to save inputs and outputs from our tools for the purposes of error debugging, bias identification, and performance improvement. External companies providing AI models used in our tools may also save and process data in accordance with their own policies. By using our tools, you consent to this data collection and processing. We reserve the right to limit the usage of our tools based on current usability factors.