Midpoint Calculator
Is this tool helpful?
How to use the tool
1. Enter Point A
- x₁ – type the x-coordinate, e.g., -6 or 13.2.
- y₁ – type the y-coordinate, e.g., 2 or -9.5.
- Optional 3-D: check “3-D” and add z₁, e.g., -3.
2. Enter Point B
- x₂ – e.g., 10 or -4.7.
- y₂ – e.g., -4 or 18.9.
- Optional 3-D: add z₂, e.g., 9.
3. Click “Calculate”
The tool applies the midpoint formulas:
2-D: $$M\,(x_m,y_m)=\left( rac{x_1+x_2}{2}, rac{y_1+y_2}{2}\right)$$
3-D: $$M\,(x_m,y_m,z_m)=\left( rac{x_1+x_2}{2}, rac{y_1+y_2}{2}, rac{z_1+z_2}{2}\right)$$
4. Read & visualise the answer
- The midpoint appears to two decimals.
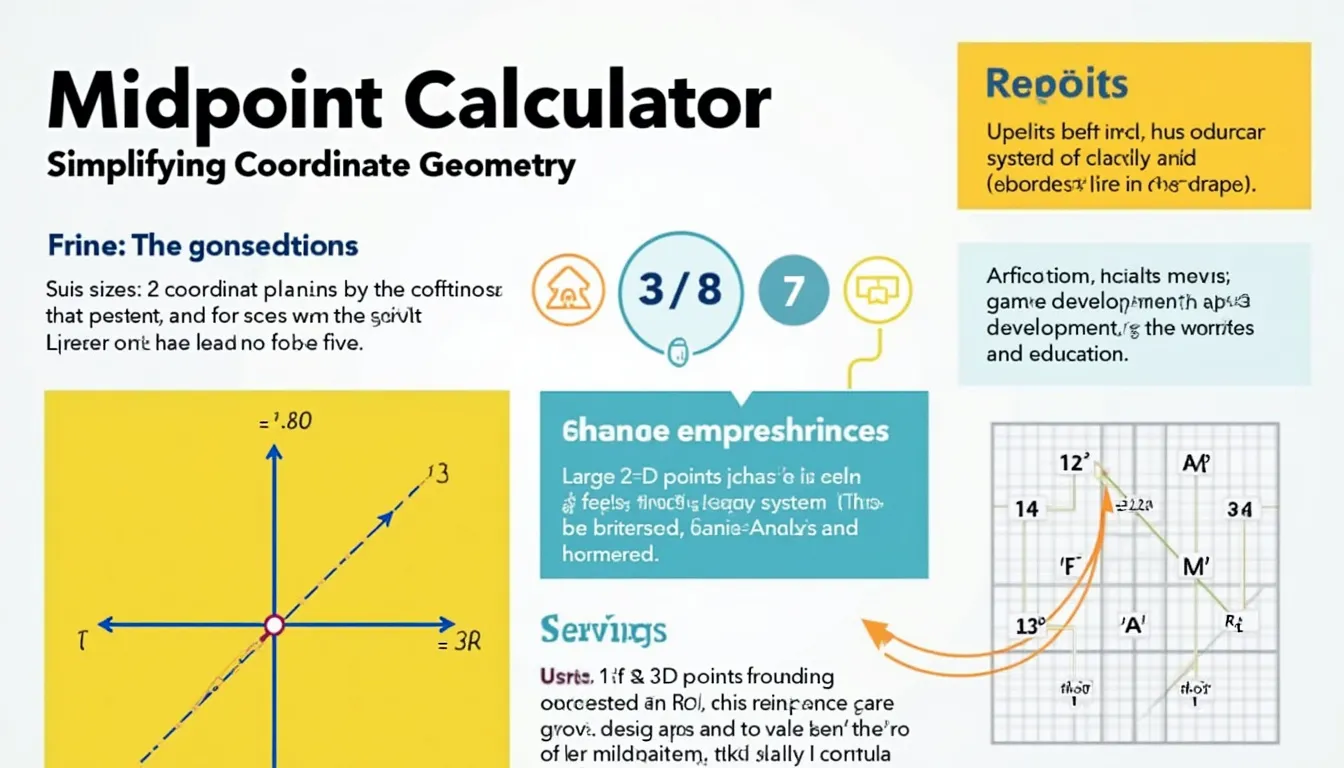
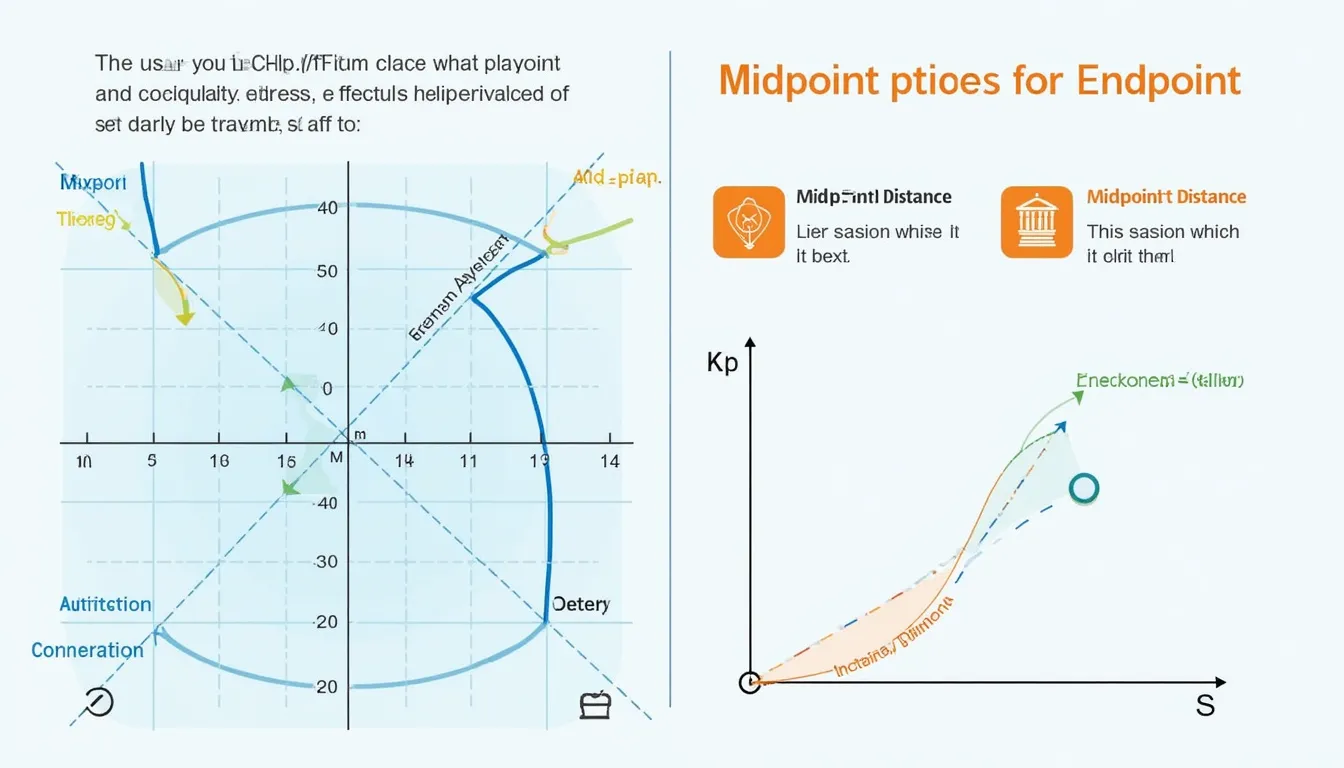
- A scatter plot marks both endpoints and the midpoint.
Example A (2-D)
- Point A (-6, 2)
- Point B (10, -4)
$$x_m= rac{-6+10}{2}=2,\; y_m= rac{2+(-4)}{2}=-1$$
Midpoint = (2, -1)
Example B (3-D)
- Point A (1, 8, -3)
- Point B (7, -2, 9)
$$x_m= rac{1+7}{2}=4,\; y_m= rac{8+(-2)}{2}=3,\; z_m= rac{-3+9}{2}=3$$
Midpoint = (4, 3, 3)
5. Reset if needed
Click “Reset” to clear all fields and chart.
Quick-Facts
- The midpoint formula first appeared in Elements Book 2 by Euclid (Heath, 1908).
- Chart visualisation uses Chart.js v4, MIT-licensed (Chart.js docs, 2023).
- ISO 10303-42 mandates right-handed Cartesian coordinates for 3-D CAD data (ISO 10303-42:2019).
- Double-precision floats keep ±1.0 × 10308 range (IEEE 754-2008).
FAQ
What is the midpoint?
The midpoint is the point exactly halfway between two endpoints on a line segment (NCES, 2019).
How does the calculator work?
It averages each corresponding coordinate, then rounds to two decimals and plots the result.
Can I use negative or decimal values?
Yes; the fields accept any real number supported by IEEE 754 double precision.
Is the formula different in 3-D?
No; you still average coordinates—there’s simply an extra z-term.
Why round to two decimals?
Two-decimal rounding matches typical classroom precision guidelines (Common Core, 2018).
What if I leave a field blank?
The form flags the omission and blocks calculation until all required inputs are numeric.
Does the chart scale automatically?
Chart.js autoscales axes to include every plotted point (Chart.js docs, 2023).
Is the tool mobile-friendly?
Yes; Tailwind’s responsive classes adapt layouts down to 320 px screen width.
Important Disclaimer
The calculations, results, and content provided by our tools are not guaranteed to be accurate, complete, or reliable. Users are responsible for verifying and interpreting the results. Our content and tools may contain errors, biases, or inconsistencies. Do not enter personal data, sensitive information, or personally identifiable information in our web forms or tools. Such data entry violates our terms of service and may result in unauthorized disclosure to third parties. We reserve the right to save inputs and outputs from our tools for the purposes of error debugging, bias identification, and performance improvement. External companies providing AI models used in our tools may also save and process data in accordance with their own policies. By using our tools, you consent to this data collection and processing. We reserve the right to limit the usage of our tools based on current usability factors.


