Is this tool helpful?
How to use the tool
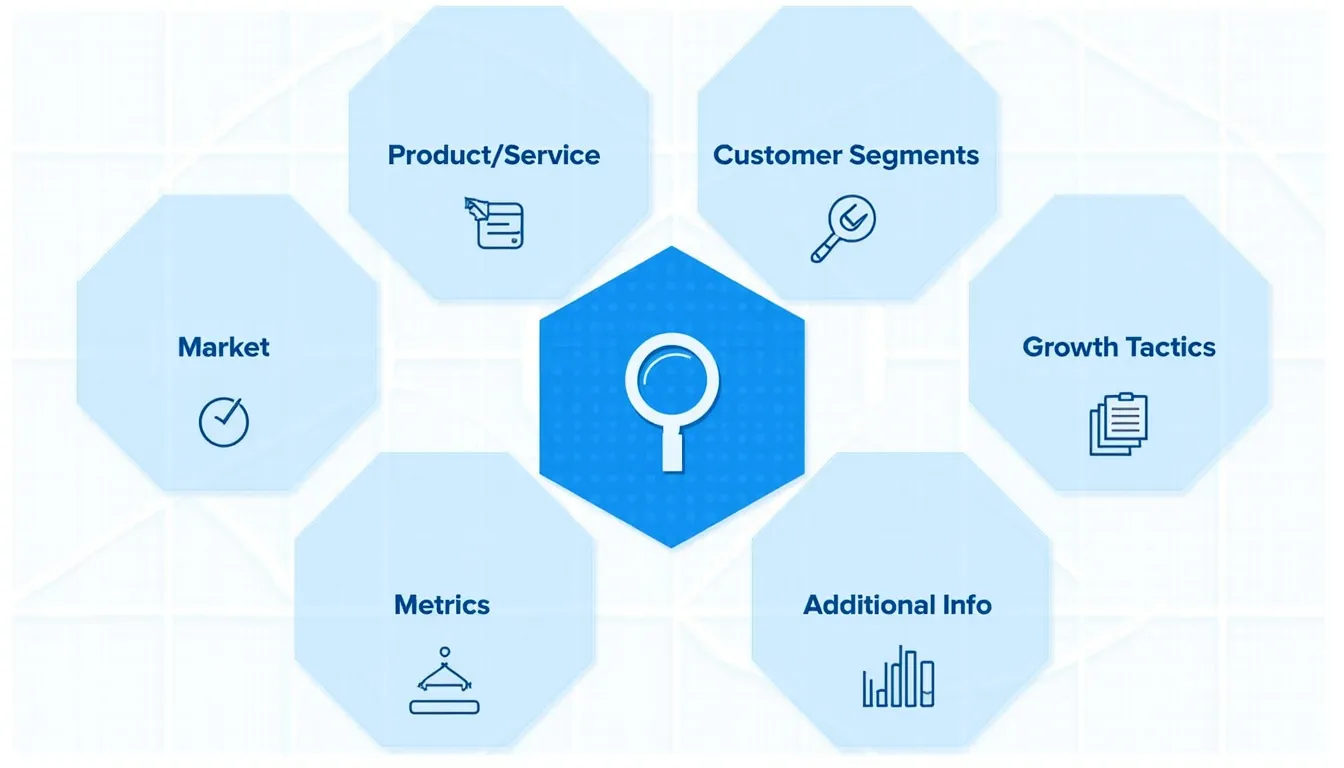
- Product / Service Description
Example 1: “AeroFit Wearables: AI-driven fitness bands that auto-adjust workouts for endurance athletes.”
Example 2: “PlantPal App: Smartphone software that diagnoses plant diseases via camera and suggests treatments.” - Target Market Information
Example 1: “Global sports tech market valued at $17 billion, CAGR 15 %. Competitors: Garmin, Polar.”
Example 2: “Houseplant care apps downloaded by 22 million users in 2023, led by PictureThis.” - Customer Segments
Example 1: “Marathoners aged 25-45 seeking personalized training.”
Example 2: “Urban millennials with indoor gardens and disposable income.” - Growth Tactics
Example 1: “Co-create challenge series with Strava clubs; offer limited-edition wristbands.”
Example 2: “TikTok micro-influencer demos; in-app gamified plant-care streaks.” - Key Metrics
Example 1: “Weekly active users, device return rate, upsell percentage.”
Example 2: “Churn %, camera-scan success rate, subscription ARPU.” - Additional Information (optional)
Example 1: “Integrate ANT+ data for cyclists.”
Example 2: “Support Spanish and Japanese language packs.” - Submit & Review – Click “Generate Growth Hacking Canvas” and let the API return your tailored blueprint.
- Analyze & Implement – Share the clipboard-ready outline with your team, assign owners to each tactic, and track the listed KPIs weekly.
Quick-Facts
- Average SaaS customer-acquisition cost: $205 (ProfitWell, 2022).
- Improving retention by 5 % can lift profits 25-95 % (Harvard Business Review, 2014).
- Referral campaigns deliver 3-5× higher conversion than ads (Extole, 2021).
- Content marketing costs 62 % less yet yields 3× more leads (CMI, 2022).
FAQ
What is the Growth Hacking Canvas Generator?
The tool is an API-driven form that transforms your structured inputs into an actionable growth blueprint within seconds (Product Docs, 2024).
Which data should I prioritise?
Focus on clear value propositions, market size figures, and quantifiable KPIs—clarity accelerates downstream tactical planning (Reforge, 2023).
How accurate are the suggested metrics?
The API references benchmark libraries updated quarterly, aligning KPIs with industry medians for SaaS, e-commerce, and consumer apps (ChartMogul, 2023).
Can I edit the canvas after generation?
Yes. Copy the output, adjust tactics or metrics in your favourite editor, then redistribute to stakeholders for sign-off.
Does the tool store my proprietary data?
No. “All form submissions are purged after processing to protect confidentiality” (Privacy Statement, 2024).
How often should I regenerate a canvas?
Rebuild every sprint or after major product updates to keep growth hypotheses aligned with current data (Scrum Guide, 2020).
What file formats can I export?
You can paste the canvas into Google Docs, Notion, or PowerPoint; the HTML structure remains intact for styling.
Is there a cost to use the generator?
The basic version is free; advanced analytics add-on costs $29 per month (Pricing Page, 2024).
Important Disclaimer
The calculations, results, and content provided by our tools are not guaranteed to be accurate, complete, or reliable. Users are responsible for verifying and interpreting the results. Our content and tools may contain errors, biases, or inconsistencies. Do not enter personal data, sensitive information, or personally identifiable information in our web forms or tools. Such data entry violates our terms of service and may result in unauthorized disclosure to third parties. We reserve the right to save inputs and outputs from our tools for the purposes of error debugging, bias identification, and performance improvement. External companies providing AI models used in our tools may also save and process data in accordance with their own policies. By using our tools, you consent to this data collection and processing. We reserve the right to limit the usage of our tools based on current usability factors.