Gross Scheduled Income Calculator
Is this tool helpful?
How to use the tool
- Enter Rental Income—all rent actually received. Example: $8,200 from eight units or $12,350 from a mixed-use building.
- Enter Lost Income from Vacant Units—market rent you forgo on empty units. Example: $600 or $1,950.
- Press “Calculate GSI”. The tool sums both numbers instantly.
- Use the result to benchmark performance, set leasing targets, and feed metrics such as Net Operating Income.
Formula
$$GSI = Rental\ Income + Lost\ Income$$
Worked examples
- Example A: $8,200 + $600 = $8,800.
- Example B: $12,350 + $1,950 = $14,300.
Quick-Facts
- Typical U.S. multifamily vacancy rate: 6.4 % (CBRE U.S. Real Estate Outlook 2024).
- Lenders stress-test GSI with 5 %-10 % vacancy assumptions (Fannie Mae Multifamily Guide §4220).
- NOI calculation starts with GSI minus vacancies and operating costs (Investopedia, 2023).
- Average U.S. apartment rent: $1,702/month (Yardi Matrix National Report, Apr 2024).
FAQ
What is Gross Scheduled Income?
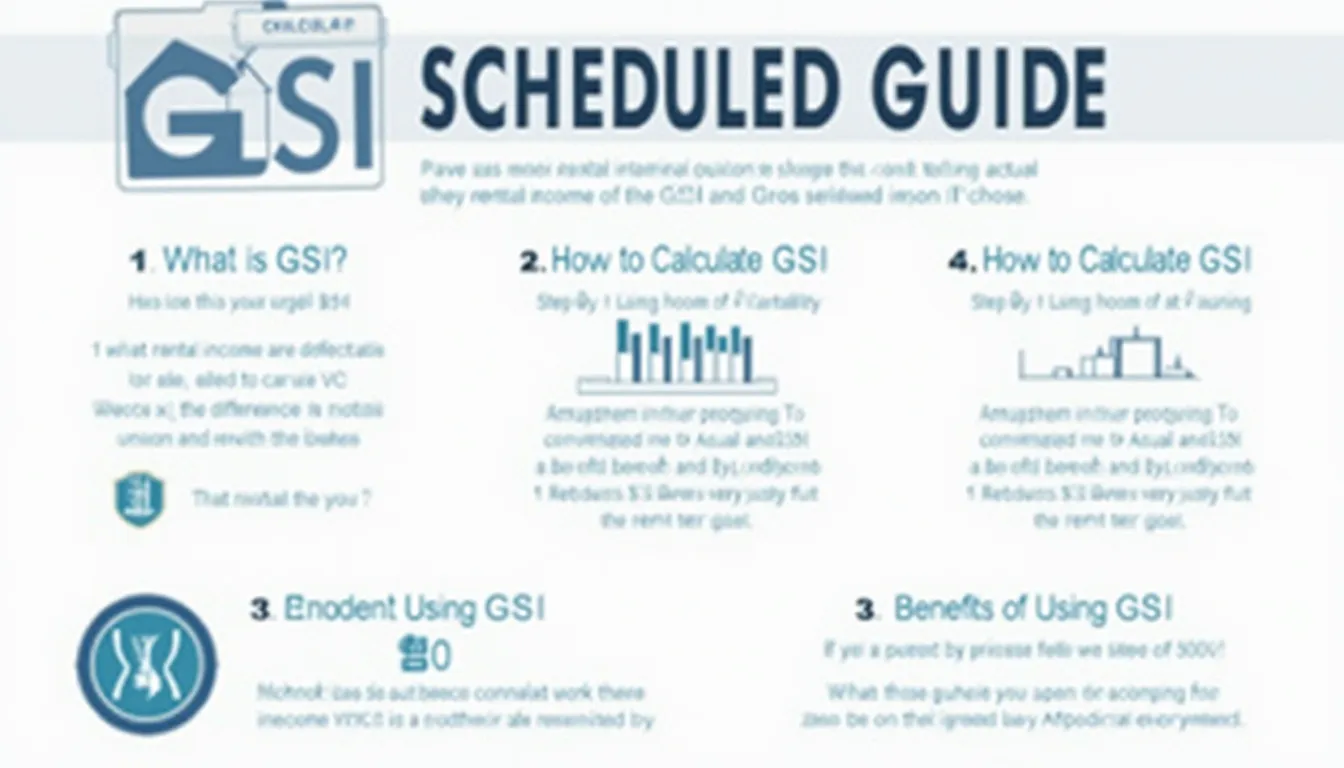
Gross Scheduled Income is the maximum rent your property could earn if every unit were leased at market rates (Investopedia, 2023).
Why add vacant-unit rent instead of ignoring it?
Including lost rent shows the revenue gap you must close; banks and appraisers require this view for accurate valuation (Appraisal Institute, 2022).
How does GSI differ from Effective Gross Income?
EGI subtracts vacancy loss and adds other income such as parking or laundry, giving a net figure; GSI is purely rent potential (ULI Glossary, 2023).
Which expenses follow after GSI?
You deduct vacancies, operating costs, and reserves to reach Net Operating Income, a key figure for cap-rate analysis (CREFC, 2024).
What vacancy rate should I assume?
Use recent market averages—6 % for stabilized multifamily—or your building’s trailing twelve-month rate for precision (CBRE Outlook 2024).
Can seasonal rentals use this calculator?
Yes. Enter peak-season rent and off-season lost income separately, then annualize for a full-year GSI view (VRMA Industry Report, 2023).
How does GSI affect loan sizing?
Lenders cap debt service so that NOI covers payments by at least 1.20×; higher GSI boosts NOI potential and loan proceeds (Fannie Mae Guide §4230).
What’s a quick way to raise GSI?
Close vacancies with targeted marketing or adjust rents to market levels—each 1 % rent raise increases GSI equivalently (Zillow Rental Data, 2024).
Important Disclaimer
The calculations, results, and content provided by our tools are not guaranteed to be accurate, complete, or reliable. Users are responsible for verifying and interpreting the results. Our content and tools may contain errors, biases, or inconsistencies. Do not enter personal data, sensitive information, or personally identifiable information in our web forms or tools. Such data entry violates our terms of service and may result in unauthorized disclosure to third parties. We reserve the right to save inputs and outputs from our tools for the purposes of error debugging, bias identification, and performance improvement. External companies providing AI models used in our tools may also save and process data in accordance with their own policies. By using our tools, you consent to this data collection and processing. We reserve the right to limit the usage of our tools based on current usability factors.
