Financial Asset Ratio Calculator
Is this tool helpful?
How to use the tool
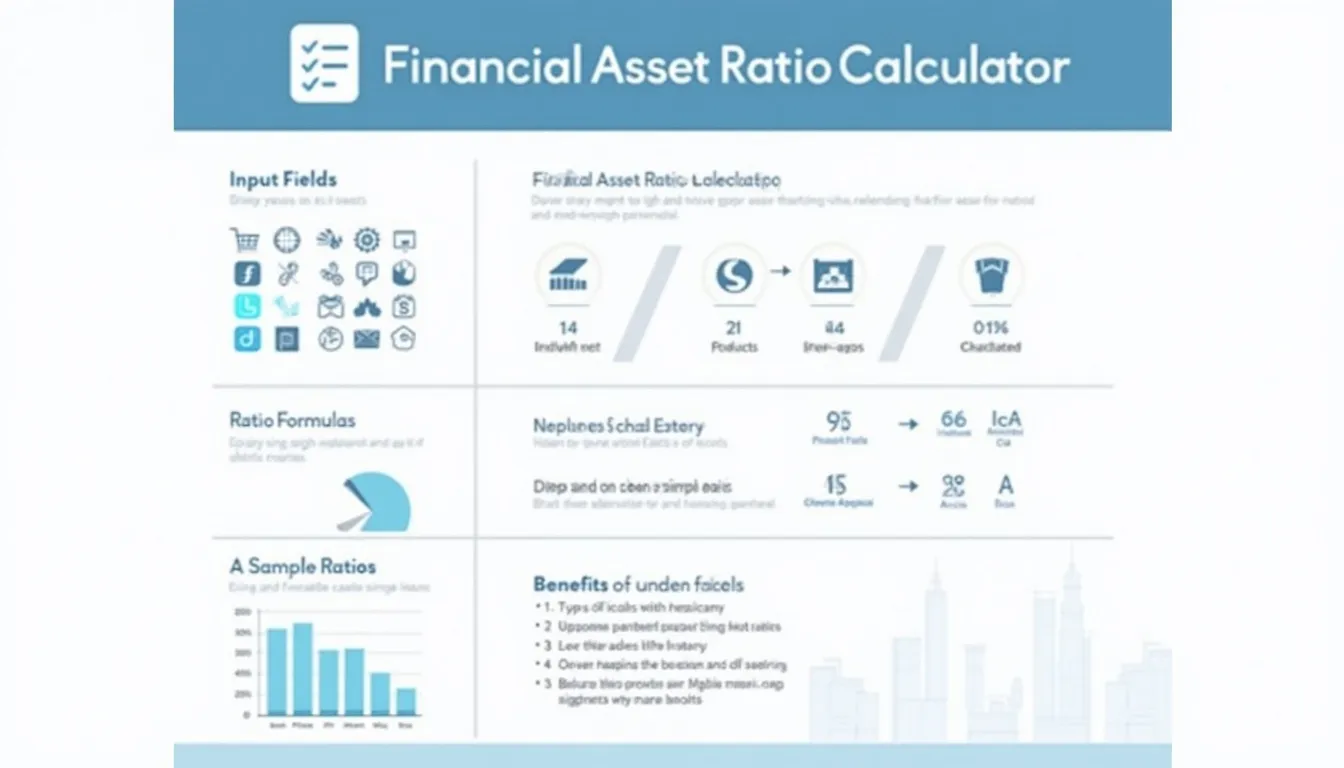
- Collect figures from the latest statements: current assets, current liabilities, total debt, total equity, net income, revenue, assets, gross profit, stock price, earnings per share.
- Enter the data—for instance:
- Current Assets: 420,000 USD
- Total Equity: 640,000 USD
- Press “Calculate Ratios” and the script instantly shows eight metrics on screen.
- Interpret results using the formulas and examples below to guide capital, pricing or funding decisions.
Formulas
- Current Ratio $$\frac{\text{Current Assets}}{\text{Current Liabilities}}$$
- Debt to Equity $$\frac{\text{Total Debt}}{\text{Total Equity}}$$
- Return on Assets $$\frac{\text{Net Income}}{\text{Total Assets}}$$
- Return on Equity $$\frac{\text{Net Income}}{\text{Total Equity}}$$
- Asset Turnover $$\frac{\text{Total Revenue}}{\text{Total Assets}}$$
- Gross Profit Margin $$\frac{\text{Gross Profit}}{\text{Total Revenue}}$$
- Net Profit Margin $$\frac{\text{Net Income}}{\text{Total Revenue}}$$
- P/E Ratio $$\frac{\text{Stock Price}}{\text{Earnings Per Share}}$$
Example A (liquidity & leverage)
Inputs: Current Assets 420,000 USD, Current Liabilities 280,000 USD, Total Debt 1,200,000 USD, Total Equity 800,000 USD.
- Current Ratio: $$\frac{420{,}000}{280{,}000}=1.50$$
- Debt to Equity: $$\frac{1{,}200{,}000}{800{,}000}=1.50$$
Example B (profitability & valuation)
Inputs: Net Income 160,000 USD, Total Assets 1,000,000 USD, Total Equity 400,000 USD, Revenue 2,400,000 USD, Gross Profit 600,000 USD, Stock Price 48 USD, EPS 3 USD.
- ROA: $$\frac{160{,}000}{1{,}000{,}000}=0.16\;(16\%)$$
- ROE: $$\frac{160{,}000}{400{,}000}=0.40\;(40\%)$$
- Asset Turnover: $$\frac{2{,}400{,}000}{1{,}000{,}000}=2.40$$
- Gross Margin: $$\frac{600{,}000}{2{,}400{,}000}=0.25\;(25\%)$$
- Net Margin: $$\frac{160{,}000}{2{,}400{,}000}=0.0667\;(6.67\%)$$
- P/E: $$\frac{48}{3}=16.00$$
Quick-Facts
- Healthy current ratio ranges 1.5-3 (Corporate Finance Institute, 2023).
- Median U.S. manufacturing debt-to-equity is 1.2 (Damodaran Online, Jan 2024).
- S&P 500 average P/E stood at 19 in 2023 (S&P Global Market Intelligence, 2024).
- ROE above 15 % signals strong performance (PwC Value Creation Report, 2023).
- GAAP urges quarterly ratio reviews for interim reporting (FASB ASC 270, 2021).
FAQ
What inputs do I need?
You need nine figures: assets, liabilities, debt, equity, revenue, net income, gross profit, current stock price, and EPS. They all appear on standard balance-sheet or income-statement pages (SEC Form 10-K).
How do I read the current ratio?
A ratio above 1 means assets exceed short-term obligations. Ratios between 1.5 and 3 indicate comfortable liquidity, whereas below 1 warns of cash-flow risk (CFI, 2023).
What is a safe debt-to-equity level?
Levels under 1 show equity finances most assets, reducing insolvency risk. Industry medians differ: utilities average 1.4, tech firms average 0.4 (Damodaran Online, 2024).
How can I improve ROA?
Raise net income via cost control or boost asset productivity by selling idle equipment. “Eliminate underused assets to lift ROA,” notes McKinsey’s Corporate Performance team (McKinsey, 2023).
How often should I recalculate ratios?
Update after every quarterly or annual report. GAAP interim reporting rules require management to monitor key ratios each quarter (FASB ASC 270, 2021).
Are these formulas industry-standard?
Yes. The calculator uses textbook definitions taught in CFA curricula and referenced by IFRS and U.S. GAAP guidance (IFRS Foundation, 2023).
Can I compare ratios across industries?
Compare within the same sector for meaningful insight. Capital-intensive sectors naturally carry higher leverage, while software firms rely less on debt (S&P Sector Report, 2024).
Does inflation distort ratio analysis?
Yes. Historical-cost accounting understates asset values during high inflation, inflating ROA and ROE. Adjust using price-level indexing for accuracy (Brealey et al., “Principles of Corporate Finance”, 2022).
Important Disclaimer
The calculations, results, and content provided by our tools are not guaranteed to be accurate, complete, or reliable. Users are responsible for verifying and interpreting the results. Our content and tools may contain errors, biases, or inconsistencies. Do not enter personal data, sensitive information, or personally identifiable information in our web forms or tools. Such data entry violates our terms of service and may result in unauthorized disclosure to third parties. We reserve the right to save inputs and outputs from our tools for the purposes of error debugging, bias identification, and performance improvement. External companies providing AI models used in our tools may also save and process data in accordance with their own policies. By using our tools, you consent to this data collection and processing. We reserve the right to limit the usage of our tools based on current usability factors.
