Is this tool helpful?
How to Use the Expert Financial Analysis Tool Effectively
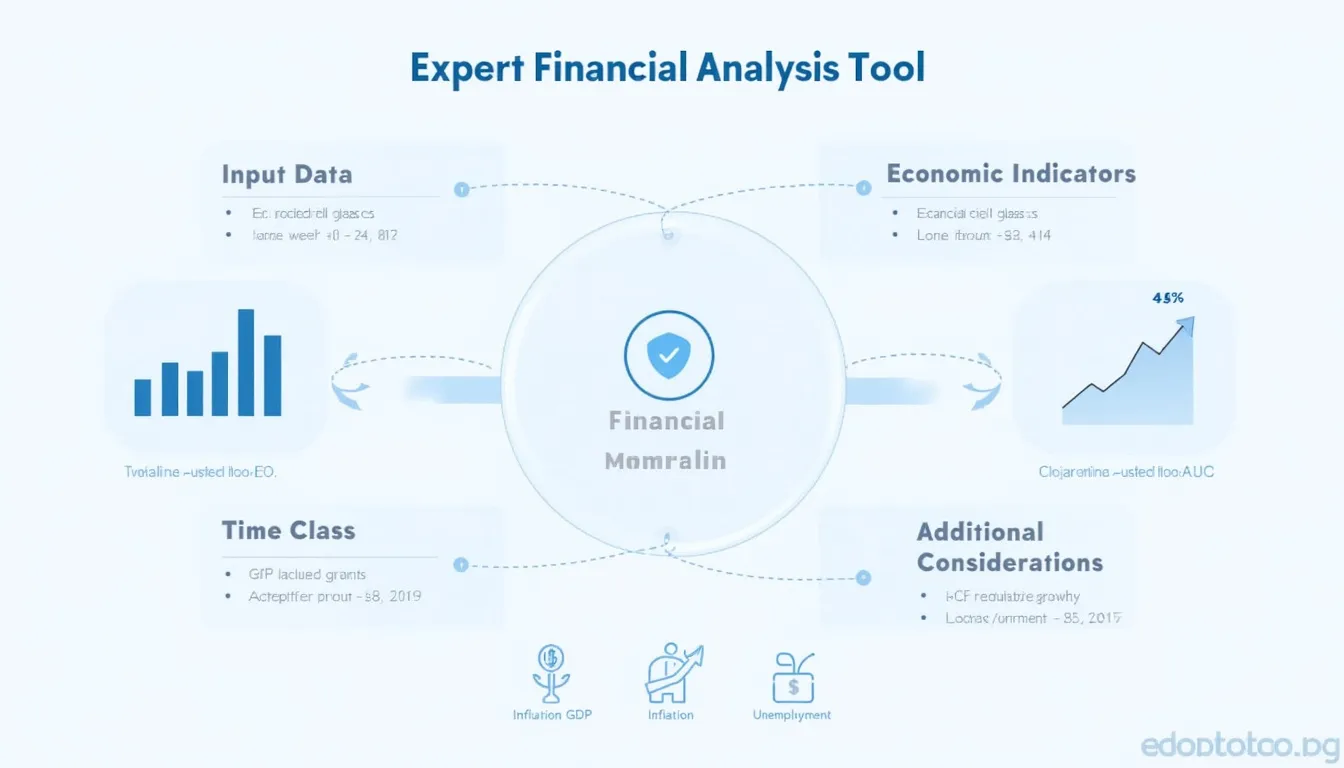
This financial analysis tool is designed to offer deep insights into long-term investment opportunities across different asset types. To harness its full potential, follow these easy steps:
- Enter the Stock Symbol or Asset: Type the ticker or asset name you wish to analyze. For instance, try “MSFT” for Microsoft Corporation or “BTC” for Bitcoin.
-
Provide Key Economic Indicators: Input vital economic data impacting your asset. Sample inputs might include:
- Consumer Price Index (CPI): 2.8%
- Interest Rate: 1.25%
- Manufacturing PMI: 54.3
- Trade Balance: -$50B
- Specify the Asset Class: Identify the asset category such as “Cryptocurrency” or “Mutual Funds.”
- Set the Time Frame (Optional): Indicate your analysis period—examples include “7 years” or “15 years.”
- Add Additional Considerations (Optional): Highlight extra factors influencing your investment decision, like emerging market risks or regulatory changes.
- Generate the Analysis: Click the button to receive a thorough, data-driven long-term financial analysis.
After generating the report, review the insights carefully. This tool helps you understand both the technical and macroeconomic dimensions affecting your investment, allowing you to make better-informed choices.
What is the Expert Financial Analysis Tool? Definition, Purpose, and Benefits
The Expert Financial Analysis Tool is a cutting-edge resource designed to evaluate financial assets through comprehensive long-term analysis. By combining technical financial indicators with key macroeconomic data, it offers investors a holistic view of potential asset performance.
Purpose of the Financial Analysis Tool
- Empower Investors: Provide both beginners and seasoned investors with professional-grade financial insights.
- Integrate Technical and Economic Data: Leverage trend analysis and economic factors for a clear picture of asset potential.
- Support Long-Term Investment Strategies: Focus on sustained growth and risk management over short-term speculation.
Key Benefits of Using This Financial Analysis Tool
- Comprehensive Investment Evaluation: Combines stock price trends, economic indicators, and sector-specific elements for well-rounded analysis.
- Customization: Tailor the inputs based on your investment focus, such as niche economic indicators or asset classes.
- Time-Efficient Decision-Making: Quickly gain insights that might otherwise require extensive research across multiple sources.
- Educational Value: Deepen your understanding of how intertwined financial markets and economies influence asset behavior.
- Long-Term Focus: Designed specifically for medium to long-term investment horizons, helping you form durable strategies.
Practical Uses of the Financial Analysis Tool
While this tool uses backend processing to analyze your inputs, here are real-world scenarios where it proves invaluable:
Scenario 1: Evaluating Emerging Market Stocks Long-Term
- Asset Example: Emerging Market ETF (EEM)
- Economic Inputs:
- GDP Growth Rate: 5.5%
- Inflation Rate: 4.1%
- Political Stability Index: Moderate
- Interest Rates: 3.0%
- Time Frame: 12 years
- Additional Insights: Rapid urbanization, infrastructure development plans, currency volatility risks
The tool examines these inputs and delivers a forecast of long-term capital appreciation, risk-adjusted returns, and economic resilience.
Scenario 2: Assessing Corporate Bond Investments
- Asset Example: Corporate Bonds from a Major Telecom Company
- Key Economic Indicators:
- Interest Rate Trends: Increasing
- Credit Spread Changes: Stable
- Inflation Rate: 2.0%
- Regulatory Environment: Favorable
- Time Horizon: 8 years
- Additional Notes: Industry competition, debt servicing capacity, anticipated interest rate cycles
The analysis highlights yield expectations and risk factors aligned with anticipated economic conditions affecting bond valuations and default likelihood.
Scenario 3: Planning a Diversified Portfolio Across Asset Classes
- Assets Included: International Stock Fund, Municipal Bonds, Gold ETFs
- Relevant Economic Inputs:
- Global GDP Growth: 3.0%
- Inflation Differentials: Varied by Region
- Interest Rate Environment: Mixed
- Currency Exchange Rate Projections
- Analysis Period: 15 years
- Additional Considerations: Geopolitical risks, climate change impact, demographic shifts
This helps you identify how diversified assets may interplay through economic cycles and provides tailored advice on allocation and risk mitigation.
Incorporating Technical and Macroeconomic Analysis for Long-Term Investment Success
The real strength of this tool lies in its blend of technical financial analysis and macroeconomic evaluation. This dual approach offers a clearer, more holistic assessment.
Key Technical Indicators Included
- Moving Averages (SMA/EMA): Trend identification through smoothed price data.
- Relative Strength Index (RSI): Detects momentum to flag overbought or oversold conditions.
- MACD (Moving Average Convergence Divergence): Highlights trend direction and strength.
- Bollinger Bands: Measures price volatility and potential reversal points.
Mathematical Foundations of Technical Analysis
Simple Moving Average (SMA)
The formula for an n-day SMA is:
$$ SMA = \frac{\sum_{i=1}^n P_i}{n} $$Where:
- $$P_i$$ = asset price on day i
- $$n$$ = number of periods
Relative Strength Index (RSI)
Calculated by:
$$ RSI = 100 – \frac{100}{1 + RS} $$Where:
- $$RS$$ = average gain during up periods / average loss during down periods over a selected time frame
Key Macroeconomic Indicators Affecting Long-Term Investments
- GDP Growth Rate: Signals overall economic vitality and capacity for corporate earnings growth.
- Inflation Rate: Influences purchasing power and real return on investments.
- Unemployment Rate: Reflects economic health impacting consumer demand.
- Interest Rates: Affect borrowing costs, capital availability, and asset valuations.
- Currency Exchange Rates: Impact international competitiveness and investment returns on foreign assets.
Interpreting the Interactions
By analyzing how these indicators interconnect, investors can better gauge the macroeconomic environment’s influence on specific assets.
- Strong GDP growth paired with low inflation and low unemployment often fosters a bullish stock market environment.
- Rising interest rates may suppress bond prices but enhance yields on fixed-income investments.
- A depreciating currency could amplify earnings for multinational corporations when revenues are converted back to the home currency.
Frequently Asked Questions (FAQ)
Q1: How often should I use the Expert Financial Analysis Tool?
It’s advisable to use the tool periodically — for instance, annually or whenever major economic shifts occur — to keep your investment strategy aligned with changing conditions.
Q2: Can this tool predict exact stock prices or guarantee investment returns?
No tool can forecast precise stock prices or eliminate risk. Our analysis is based on historical data patterns and macroeconomic trends to help you make informed decisions, but all investments involve uncertainty.
Q3: How does the tool handle conflicting economic indicators?
The tool applies advanced weighting algorithms to balance contradictory data and provide a nuanced interpretation, highlighting both potential risks and opportunities.
Q4: Is this tool suitable for short-term trading decisions?
While it includes some technical analysis elements, this tool is primarily optimized for long-term investment assessment rather than short-term trades.
Q5: How does the tool address unforeseen events like black swan scenarios?
Although unpredictable events cannot be foreseen, the comprehensive nature of the tool aids in constructing a resilient portfolio designed to withstand economic shocks.
Q6: Can I analyze international investments with this tool?
Absolutely. Be sure to include relevant economic indicators and considerations specific to the countries or regions of your investments for tailored insights.
Important Disclaimer
The calculations, results, and content provided by our tools are not guaranteed to be accurate, complete, or reliable. Users are responsible for verifying and interpreting the results. Our content and tools may contain errors, biases, or inconsistencies. We reserve the right to save inputs and outputs from our tools for the purposes of error debugging, bias identification, and performance improvement. External companies providing AI models used in our tools may also save and process data in accordance with their own policies. By using our tools, you consent to this data collection and processing. We reserve the right to limit the usage of our tools based on current usability factors. By using our tools, you acknowledge that you have read, understood, and agreed to this disclaimer. You accept the inherent risks and limitations associated with the use of our tools and services.