EPS Growth Rate Calculator
Is this tool helpful?
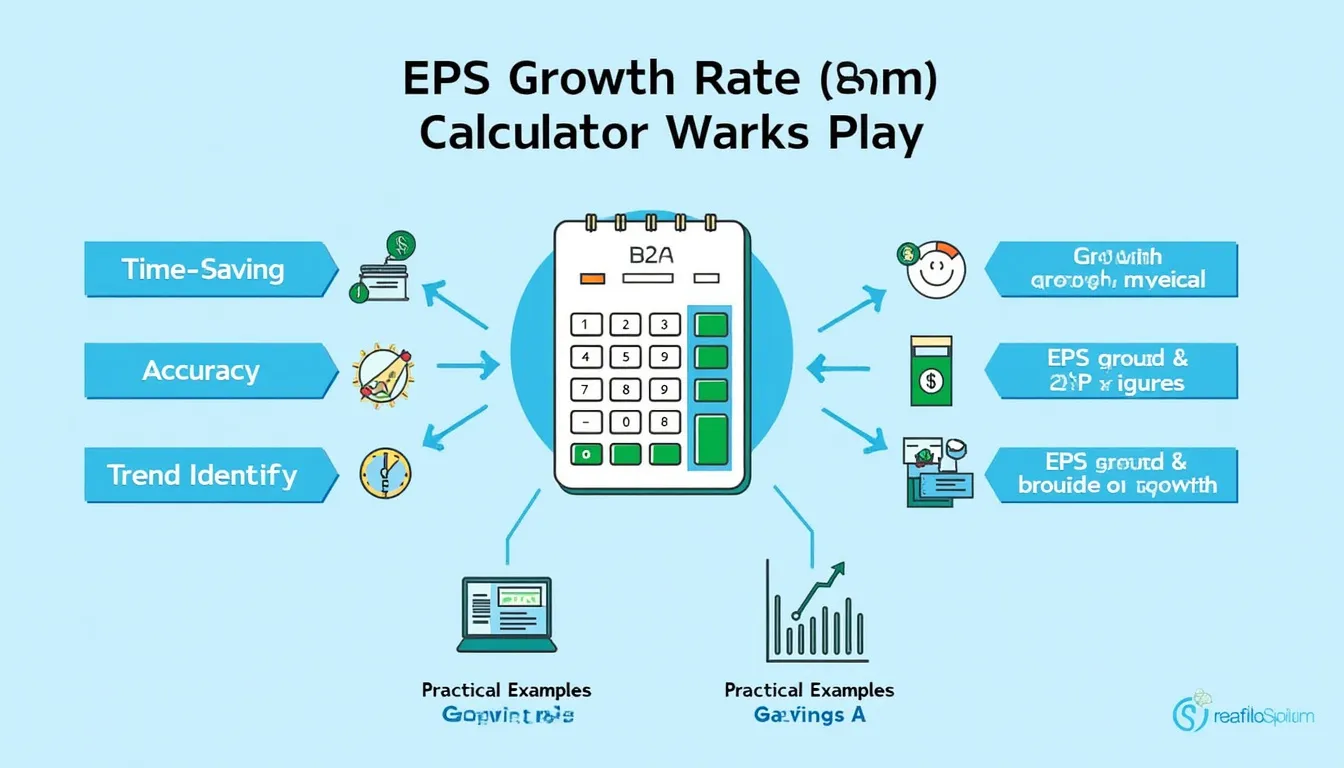
How to use the tool
- Fill “Initial EPS”: Type your starting earnings per share, e.g., 0.85 or 5.00.
- Fill “Ending EPS”: Enter the later value, e.g., 1.20 or 6.50.
- Press Calculate: The tool returns the growth rate as a percentage.
- Read the output: Positive means earnings rose; negative signals a decline.
Formula used
$$\text{EPS Growth Rate} = rac{\text{Ending EPS} – \text{Initial EPS}}{\text{Initial EPS}}\times100\%$$
Example A
- Initial EPS: 0.85
- Ending EPS: 1.20
The calculator shows 41.18 % growth: $$ rac{1.20-0.85}{0.85}\times100 = 41.18\%$$
Example B
- Initial EPS: 5.00
- Ending EPS: 6.50
The calculator shows 30 % growth: $$ rac{6.50-5.00}{5.00}\times100 = 30\%$$
Quick-Facts
- EPS figures update quarterly in U.S. filings (SEC Form 10-Q) [SEC.gov].
- Typical EPS growth range for S&P 500 stocks: −50 % to +50 % per year (Morningstar, 2024).
- Free data: EDGAR database, company investor pages (SEC.gov).
- Standard definition follows IAS 33 “Earnings per Share” (IFRS.org).
- Negative EPS growth signals falling profitability, a key risk flag (CFA Institute, 2023).
FAQ
What is EPS Growth Rate?
EPS Growth Rate is the percentage change in earnings per share between two dates, highlighting profitability momentum (Investopedia, URL).
Why does EPS growth matter to investors?
Rising EPS indicates a firm generates more profit per share, often boosting valuation and dividends (Damodaran, 2023).
How do you calculate it manually?
Subtract initial EPS from ending EPS, divide by initial, then multiply by 100; see the formula above (CFA Institute, 2023).
What is a healthy benchmark?
Consistent growth above inflation and sector average—roughly 5 %-15 % for large caps—is viewed as sustainable (FactSet, 2024).
Can you compare EPS growth across industries?
Yes, but adjust for cyclicality; utilities grow slower than tech, so context matters (S&P Global, 2024).
How do buybacks distort EPS growth?
Repurchases cut share count, raising EPS even if net income stalls, so examine both metrics (SEC Investor Bulletin, 2023).
Does inflation affect analysis?
High inflation can inflate nominal EPS; compare real (inflation-adjusted) growth for clarity (BLS CPI Report, 2024).
Where can you find reliable EPS data?
Use audited annual reports, SEC filings, or verified data services such as Refinitiv and Bloomberg (Refinitiv Datascope, 2024).
Important Disclaimer
The calculations, results, and content provided by our tools are not guaranteed to be accurate, complete, or reliable. Users are responsible for verifying and interpreting the results. Our content and tools may contain errors, biases, or inconsistencies. Do not enter personal data, sensitive information, or personally identifiable information in our web forms or tools. Such data entry violates our terms of service and may result in unauthorized disclosure to third parties. We reserve the right to save inputs and outputs from our tools for the purposes of error debugging, bias identification, and performance improvement. External companies providing AI models used in our tools may also save and process data in accordance with their own policies. By using our tools, you consent to this data collection and processing. We reserve the right to limit the usage of our tools based on current usability factors.


