Is this tool helpful?
How to Use the Dynamic Knowledge Synthesis Tool Effectively
Follow these simple steps to get the most out of the Dynamic Knowledge Synthesis Tool and create clear, integrated insights from multiple perspectives:
-
Main Topic or Issue: Enter the central theme you want to explore. For example:
- “Improving Remote Learning Accessibility”
- “Optimizing Supply Chain Resilience”
-
Stakeholder Inputs: Provide viewpoints from different participants or sources. Include each input on a new line. Examples include:
- “Marketing Team: Target expanding towards younger demographics”
- “Finance Department: Budget constraints emphasize cost control”
- “Customer Feedback: Demand for faster delivery options”
-
Synthesis Settings:
- Maximum Synthesis Cycles (default is 5): Number of iterative analysis rounds to refine insights.
- Convergence Threshold (default is 0.01): Defines when the synthesis process stabilizes with minimal changes.
-
Visualization Format: Choose how you want to view the synthesis results:
- Venn Diagram: Visualizes overlapping ideas among stakeholder inputs.
- Bar Chart: Displays consensus versus divergence in the data.
- Mind Map: Shows relationships and connections between concepts.
Introduction to the Dynamic Knowledge Synthesis Tool
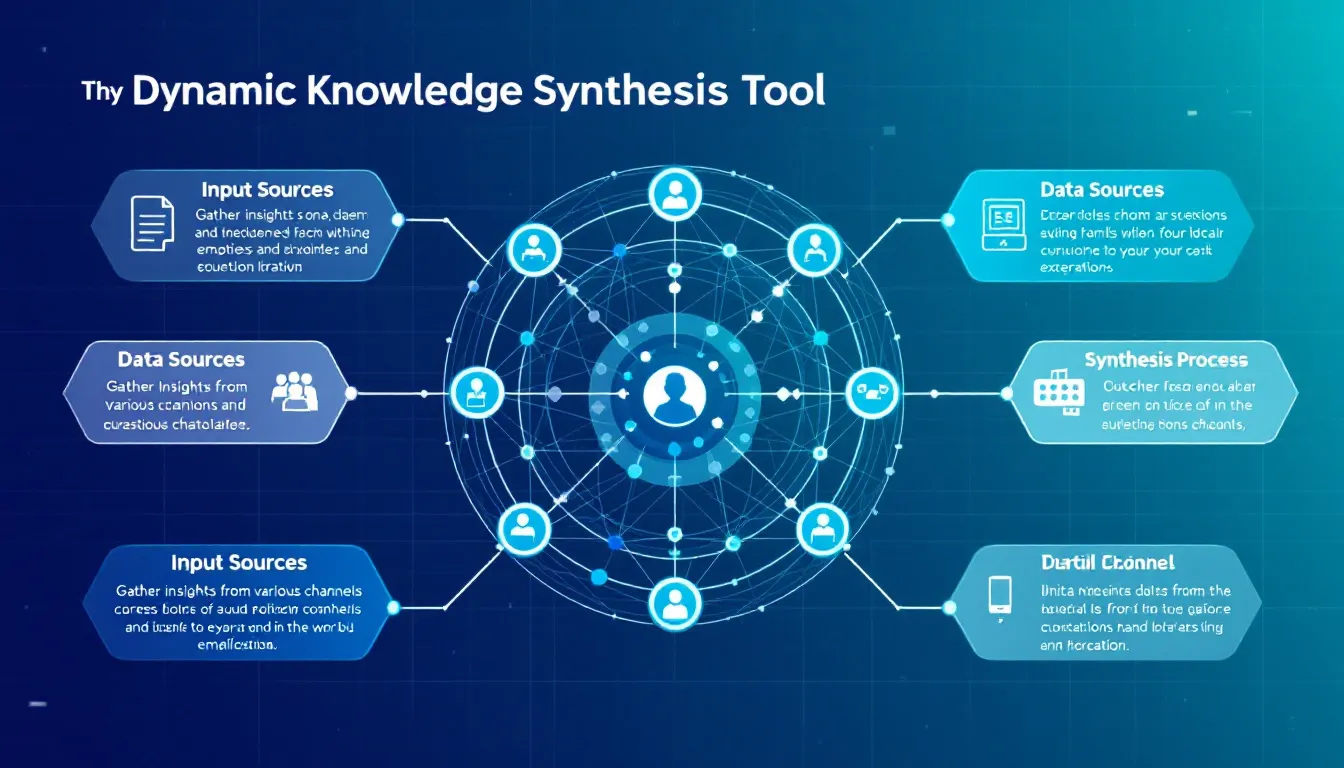
The Dynamic Knowledge Synthesis Tool is designed to help you combine diverse perspectives and data points into a cohesive understanding. It uses iterative cycles to process complex information, revealing areas of agreement and disagreement among multiple stakeholders.
By integrating varied inputs—from research findings and expert opinions to user feedback—it enables you to develop more balanced solutions and informed decisions. The tool accelerates knowledge integration, saves time, and supports clearer communication between involved parties.
Key Benefits
- Integrated Insights: Merges inputs from different sources to provide a full picture.
- Iterative Refinement: Improves synthesis with multiple analysis cycles for accuracy.
- Visual Clarity: Offers customizable visualizations for easier interpretation.
- Stakeholder Alignment: Highlights consensus and pinpoints areas needing attention.
- Decision Support: Helps streamline complex problem-solving through structured analysis.
Practical Uses of the Dynamic Knowledge Synthesis Tool
The tool applies particularly well to scenarios that involve multiple viewpoints and require structured integration of data or opinions. Here are common use cases that illustrate its value:
Policy Formulation
When developing policies, the tool gathers inputs from government agencies, community groups, and economic advisors to create balanced strategies.
- Input Sources:
- Urban Planning Department: Zoning and land-use data
- Environmental Council: Sustainability impact assessments
- Resident Surveys: Local priorities and concerns
- Synthesis Results:
- Areas of agreement on green space preservation
- Divergent views on development density limits
- Recommendations for phased implementation based on available resources
Market Research and Product Development
Combine customer feedback, competitor analysis, and sales data to refine product strategies that address real needs effectively.
- Input Sources:
- Customer Experience Team: Pain points and suggestions
- Competitive Intelligence: Feature comparisons
- Sales Reports: Performance trends and forecasts
- Synthesis Outputs:
- Identification of key features for prioritization
- Optimized pricing strategy based on consumer willingness
- Timeline recommendations for product launch phases
Educational Program Planning
When updating curricula or designing courses, the tool helps merge academic objectives, industry needs, and student input.
- Stakeholder Views:
- Faculty: Core knowledge areas and learning outcomes
- Industry Partners: In-demand skills and certifications
- Students: Preferred learning styles and career goals
- Integrated Synthesis:
- Balanced academic and practical skill requirements
- Inclusion of experiential learning projects
- Plans for industry collaboration and internships
Mathematical Concepts Behind Synthesis
The tool’s synthesis cycles rely on mathematical measures that quantify how perspectives align and diverge. These calculations guide the iterative refinement process.
Key formulas include:
Similarity Index (S): Measures the overlap between two stakeholder inputs A and B.
$$D = 1 – \frac{|A \cap B|}{|A \cup B|}$$Divergence Measure (D): Quantifies how different two inputs are.
$$U = \frac{w_1P + w_2F}{w_1 + w_2}$$Updated Synthesis Score (U): Combines previous synthesis score (P) and new feedback (F) weighted by (w_1) and (w_2).
Tips for Maximizing Your Use of the Tool
- Include 3 to 7 diverse perspectives to balance coverage without complicating synthesis.
- Organize inputs clearly by stakeholder group or thematic categories for better clarity.
- Choose visualization types that fit your analysis goals: use Venn diagrams for overlaps, bar charts for comparisons, and mind maps for relationship mapping.
- Iterate regularly—conduct synthesis cycles weekly or monthly as new information emerges.
- Use convergence threshold to determine when you have reached stable conclusions and consensus.
Frequently Asked Questions
What kinds of topics work best with this synthesis tool?
It excels at complex problems requiring input from multiple stakeholders, such as strategic planning, policy development, market research, and educational program design.
How many stakeholder inputs should I include?
Between three and seven well-differentiated perspectives typically generate clear, actionable synthesis without overwhelming the process.
Should I prioritize qualitative or quantitative data?
Use both. Quantitative data strengthens visual and metric outputs, while qualitative insights enrich the narrative synthesis and thematic understanding.
How do I know when the synthesis is complete?
Monitor the convergence threshold. When consecutive synthesis cycles yield negligible changes and key stakeholders show agreement, you have reached consensus.
How often should synthesis cycles run?
For fast-moving topics, weekly or monthly synthesis works best. For stable issues, quarterly cycles suffice to keep insights up to date.
Important Disclaimer
The calculations, results, and content provided by our tools are not guaranteed to be accurate, complete, or reliable. Users are responsible for verifying and interpreting the results. Our content and tools may contain errors, biases, or inconsistencies. Do not enter personal data, sensitive information, or personally identifiable information in our web forms or tools. Such data entry violates our terms of service and may result in unauthorized disclosure to third parties. We reserve the right to save inputs and outputs from our tools for the purposes of error debugging, bias identification, and performance improvement. External companies providing AI models used in our tools may also save and process data in accordance with their own policies. By using our tools, you consent to this data collection and processing. We reserve the right to limit the usage of our tools based on current usability factors.


