Dividend Yield Ratio Calculator
Is this tool helpful?
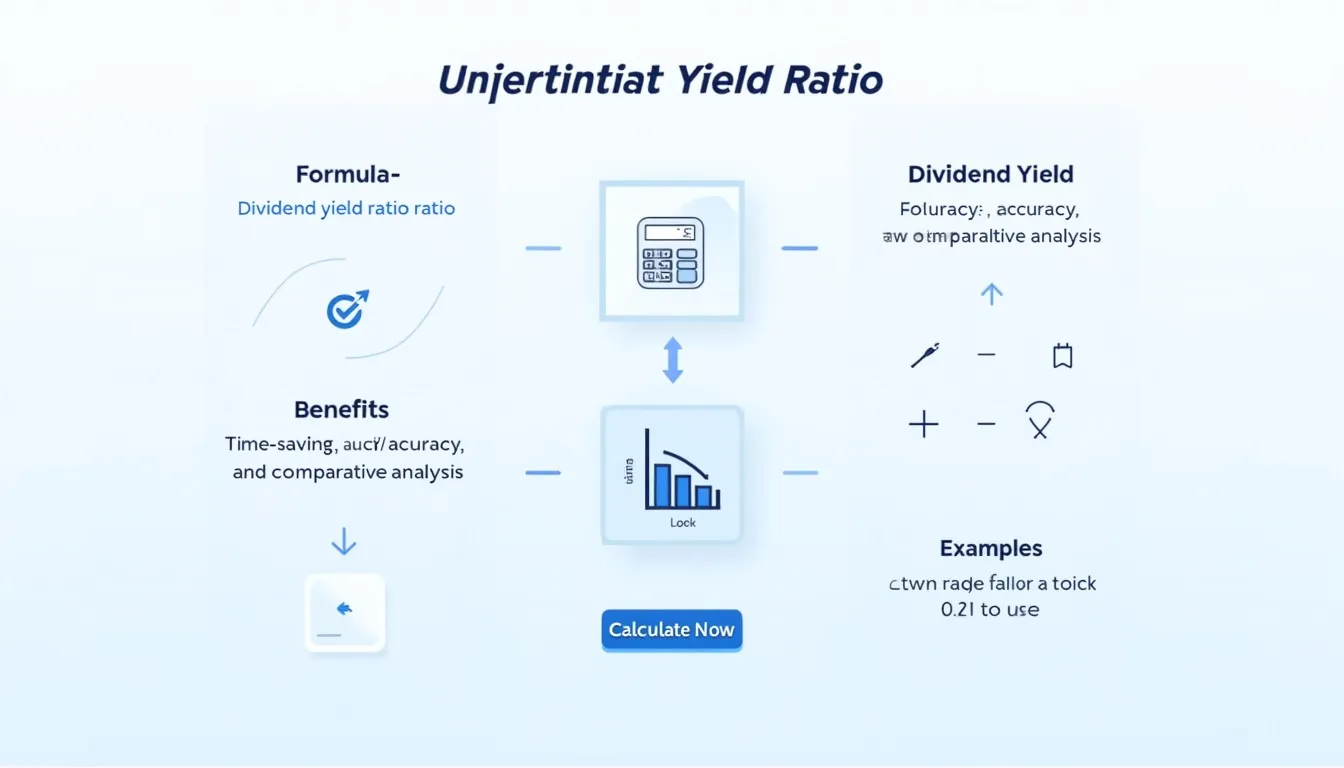
How to use the tool
- Enter Dividend per Share – type the annual payout, e.g. 2.25 USD or 3.80 USD.
- Enter Current Share Price – add the market price, such as 75.00 USD or 47.50 USD.
- Press “Calculate” – the tool shows yield instantly and repeats your inputs for clarity.
- Interpret the number – compare the percentage with sector or index averages to judge income potential.
Formula used
$$ \text{Dividend Yield Ratio}= rac{\text{Dividend per Share}}{\text{Share Price}}\times100\% $$
Example calculations
- Example A: 2.25 USD ÷ 75.00 USD × 100 = 3.00 %.
- Example B: 3.80 USD ÷ 47.50 USD × 100 = 8.00 %.
Quick-Facts
- Average S&P 500 yield: 1.6 % in 2023 (S&P Global Market Intelligence, 2024).
- Utilities sector tops U.S. sectors at ~3.6 % yield (Fidelity Sector Scorecard, 2024).
- Most U.S. firms pay dividends quarterly (Investopedia, “Dividend”, URL).
- Yields above 10 % often signal payout risk (SEC Investor Bulletin, 2023).
FAQ
What is the dividend yield ratio?
The ratio shows annual cash returns per share relative to today’s price, expressed as a percentage (Investopedia, “Dividend Yield”).
Why can a very high yield be dangerous?
“Extra-high yields may reflect financial distress and an unsustainable payout” (SEC Investor Bulletin, 2023). Falling prices inflate the ratio, so verify profit trends.
How often should I recalculate yield?
Update after each dividend announcement or any significant price move; quarterly reviews match most U.S. payment schedules (Nasdaq Dividend Calendar, 2024).
Which factors change the yield?
Dividends declared, share-price swings, special payouts, and currency shifts for ADRs all move the ratio (Morningstar Guide, 2023).
What is “yield on cost”?
Yield on cost divides current annual dividend by your original purchase price, revealing income growth over time (Bogleheads Wiki, URL).
Does a high yield predict future returns?
No. Yield is backward-looking; total return also depends on price appreciation and payout sustainability (Fama & French, Journal of Finance 2015).
Where can I find reliable dividend per share data?
Use company 10-K filings, investor relations pages, or regulated data vendors like EDGAR and FactSet (SEC.gov Filings, 2024).
How safe are dividends during recessions?
Between 2008–2009, 57 % of S&P 500 dividend payers cut or froze payouts (Howard Silverblatt, S&P Dow Jones Indices, 2010), showing income risk rises in downturns.
Important Disclaimer
The calculations, results, and content provided by our tools are not guaranteed to be accurate, complete, or reliable. Users are responsible for verifying and interpreting the results. Our content and tools may contain errors, biases, or inconsistencies. We reserve the right to save inputs and outputs from our tools for the purposes of error debugging, bias identification, and performance improvement. External companies providing AI models used in our tools may also save and process data in accordance with their own policies. By using our tools, you consent to this data collection and processing. We reserve the right to limit the usage of our tools based on current usability factors. By using our tools, you acknowledge that you have read, understood, and agreed to this disclaimer. You accept the inherent risks and limitations associated with the use of our tools and services.
