Diluted Earnings per Share Calculator
Is this tool helpful?
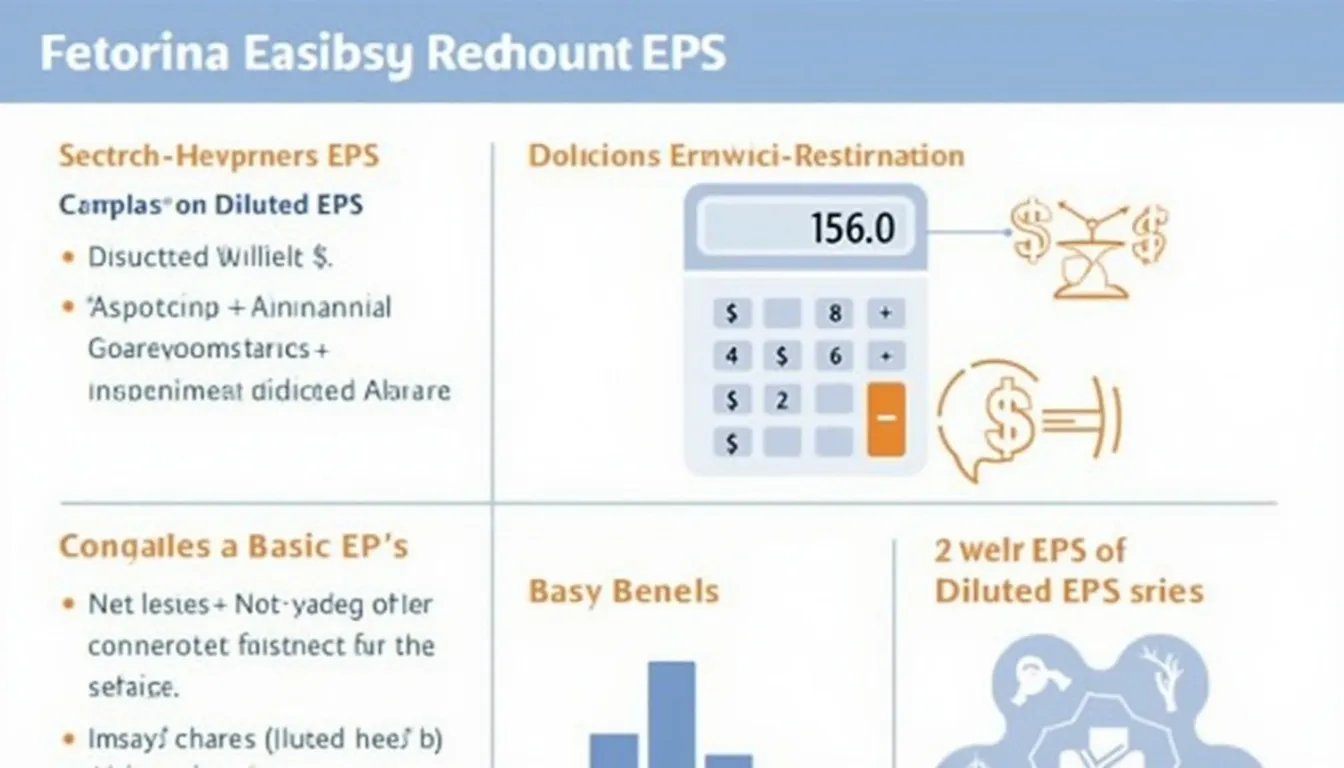
How to Use the Diluted EPS Calculator Effectively
Our Diluted Earnings per Share (EPS) Calculator simplifies complex financial computations, making it easy to evaluate a company’s earnings on a per-share basis, accounting for potential dilution. Follow these straightforward steps to maximize the benefit of this tool:
-
Enter Net Income: Provide the company’s net income in dollars. Example:
85,000,000
or120,500,000
. -
Input Average Shares Outstanding: Enter the average number of shares outstanding during the period. Example:
30,000,000
or75,000,000
. -
Provide Other Convertible Instruments: Include the total number of shares that could be issued through convertible securities like stock options and convertible bonds. Example:
4,500,000
or10,000,000
. - Click Calculate: The calculator then instantly determines the Diluted EPS, presenting the result rounded to two decimal places for clarity and precision.
This tool offers a user-friendly design, enabling you to quickly assess and compare the profitability of different companies or examine performance changes over multiple periods with ease.
Diluted Earnings per Share: Definition, Purpose, and Benefits
Diluted Earnings per Share (Diluted EPS) is a vital financial metric used to evaluate a company’s profitability per share while accounting for potential share dilution. Unlike Basic EPS, Diluted EPS considers all possible shares that could be created through convertible securities, giving investors and analysts a more conservative and realistic estimate of earnings per share.
Mathematically, Diluted EPS is calculated as:
$$\text{Diluted EPS} = \frac{\text{Net Income}}{\text{Average Shares Outstanding} + \text{Other Convertible Instruments}}$$
Key benefits of using Diluted EPS include:
- A more accurate reflection of earnings potential by incorporating all dilutive securities
- Enhanced comparability across companies with varying资本结构s
- Better understanding of shareholder ownership dilution risk
- Improved support for investment decisions and financial analysis
Example Calculations Using the Diluted EPS Calculator
To illustrate the practical use of this JavaScript-based calculator, consider these example scenarios where you input different financial data to compute Diluted EPS:
Scenario 1: Growing Tech Company
- Net Income: $95,000,000
- Average Shares Outstanding: 40,000,000
- Other Convertible Instruments: 7,000,000
Calculated Diluted EPS: $95,000,000 ÷ (40,000,000 + 7,000,000) = $2.02
Scenario 2: Established Manufacturing Firm
- Net Income: $220,500,000
- Average Shares Outstanding: 110,000,000
- Other Convertible Instruments: 15,000,000
Calculated Diluted EPS: $220,500,000 ÷ (110,000,000 + 15,000,000) = $1.86
These examples demonstrate how varying convertible securities affect earnings per share, highlighting the importance of considering dilution for accurate financial assessments.
Advantages of Using Our Diluted EPS Calculator for Precise Financial Analysis
Our powerful Diluted EPS Calculator is an essential tool for investors, analysts, CFOs, and financial professionals looking to streamline and enhance their earnings evaluations. Key advantages include:
- Efficiency: Eliminate manual calculations and time-consuming spreadsheet errors
- Accuracy: Receive precise and consistent Diluted EPS values based on entered data
- Accessibility: Use from any device with an internet connection, anytime, anywhere
- User-Friendly Interface: Navigate the intuitive design with ease regardless of financial expertise
- Instant Insight: Quickly visualize the effect of different convertible instruments on earnings per share
Practical Applications and Real-World Use Cases
Investment Decision-Making
Investors can leverage this calculator to compare companies across sectors, adjusting for all dilutive shares to ensure an apples-to-apples evaluation of profitability. For example, determining whether a startup with higher convertible instruments offers better long-term value than an established firm.
Corporate Financial Planning
Finance professionals use the tool to assess the impact of issuing convertible bonds or stock options on a company’s diluted earnings. These insights support strategic capital raising decisions and shareholder value management.
Earnings Forecasting and Reporting
Analysts and CFOs forecast future earnings under various scenarios, using the calculator to model how changes in convertible instruments or net income affect Diluted EPS, improving report accuracy and financial transparency.
Frequently Asked Questions About Diluted EPS
1. What differentiates Basic EPS from Diluted EPS?
Basic EPS includes only currently outstanding shares, while Diluted EPS factors in all possible shares that could dilute ownership, such as converts, options, and warrants, providing a more conservative earnings estimate.
2. Why is Diluted EPS important to investors and analysts?
It offers a realistic view of earnings per share after accounting for dilution risks, improving investment decisions and competitive comparisons.
3. How frequently should Diluted EPS be calculated?
Typically reported quarterly and annually, but it can be calculated anytime investors or analysts require updated assessments based on new financial data.
4. Can Diluted EPS ever exceed Basic EPS?
While uncommon, Diluted EPS can be higher if convertible instruments are anti-dilutive, meaning their conversion would increase earnings per share.
5. What falls under “Other Convertible Instruments”?
This category includes convertible preferred shares, convertible bonds, stock options, warrants, and any other securities potentially convertible to common shares.
6. How reliable is this Diluted EPS Calculator?
While designed for accuracy based on inputs, users should verify results and consult financial professionals before making significant financial decisions, as the tool cannot guarantee perfect accuracy in all scenarios.
Conclusion: Enhance Your Financial Insights with the Diluted EPS Calculator
Our Diluted Earnings per Share Calculator equips you with a robust, accurate, and user-friendly financial analysis tool. By considering all potential share dilution, it empowers you to:
- Make well-informed and data-driven investment choices
- Conduct comprehensive evaluations of company valuations
- Understand the implications of dilutive securities on shareholder earnings
- Compare companies fairly across differing share structures
- Streamline and enhance your financial reporting and forecasting tasks
Start leveraging this powerful tool today to elevate your financial analysis, whether you are an investor, analyst, or finance professional aiming for sharper insights and better decision-making.
Important Disclaimer
The calculations, results, and content provided by our tools are not guaranteed to be accurate, complete, or reliable. Users are responsible for verifying and interpreting the results. Our content and tools may contain errors, biases, or inconsistencies. We reserve the right to save inputs and outputs from our tools for the purposes of error debugging, bias identification, and performance improvement. External companies providing AI models used in our tools may also save and process data in accordance with their own policies. By using our tools, you consent to this data collection and processing. We reserve the right to limit the usage of our tools based on current usability factors. By using our tools, you acknowledge that you have read, understood, and agreed to this disclaimer. You accept the inherent risks and limitations associated with the use of our tools and services.
