Defensive Interval Ratio Calculator
Is this tool helpful?
How to use the tool
- Cash – type your on-hand money. Example: 130 000 or 310 000 USD.
- Marketable Securities – add liquid investments. Example: 90 000 or 175 000 USD.
- Net Receivables – insert collectible customer balances. Example: 70 000 or 140 000 USD.
- Annual Operating Expenses – total yearly outgoings. Example: 650 000 or 2 400 000 USD.
- Non-Cash Charges – depreciation, amortisation, etc. Example: 20 000 or 150 000 USD.
- Press Calculate; the tool instantly shows Current Assets, Daily Operational Expenses and Defensive Interval Ratio.
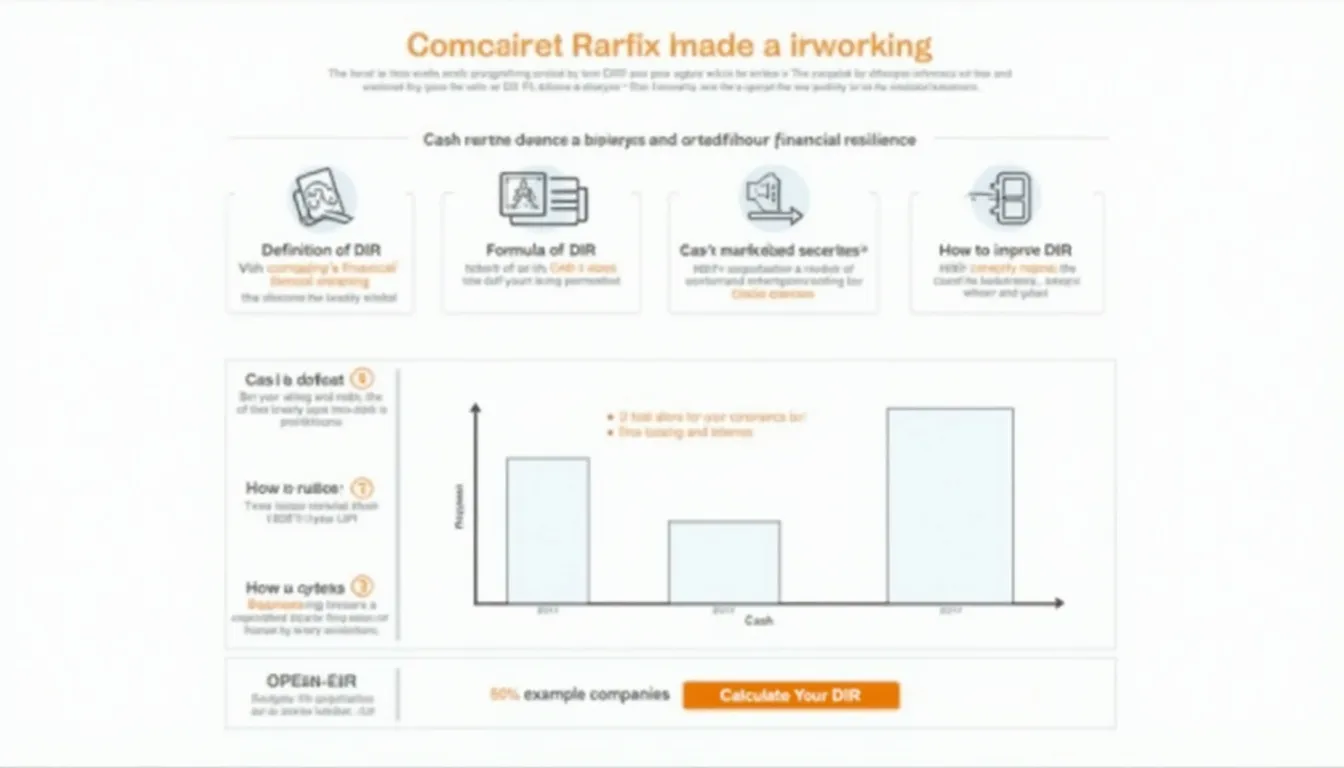
Formulas used
$$\text{Current Assets}= \text{Cash} + \text{Marketable Securities} + \text{Net Receivables}$$
$$\text{Daily Operational Expenses}= rac{\text{Annual Operating Expenses} – \text{Non-Cash Charges}}{365}$$
$$\text{Defensive Interval Ratio}= rac{\text{Current Assets}}{\text{Daily Operational Expenses}} \;(\text{days})$$
Worked examples
- Scenario A: 130 000 + 90 000 + 70 000 = 290 000 USD current assets. Daily expenses = (650 000–20 000)/365 ≈ 1 726.03 USD. DIR = 290 000/1 726.03 ≈ 168.1 days.
- Scenario B: 500 000 + 200 000 + 250 000 = 950 000 USD current assets. Daily expenses = (2 400 000–150 000)/365 ≈ 6 164.38 USD. DIR ≈ 154.2 days.
Quick-Facts
- Healthy DIR range for manufacturers: 120–180 days (Corporate Finance Institute, 2024).
- Service firms average 90–120 days due to lighter inventories (PwC Working Capital Report 2023).
- Some analysts use 360 instead of 365 days for simplicity (Brigham & Ehrhardt, Financial Management 15e).
- Cash holdings in S&P 500 sit at ~13 % of total assets (FactSet Cash & Investments Trends 2023).
FAQ
What is the Defensive Interval Ratio?
The ratio tells how many days you can meet operating costs using liquid assets without new revenue (Investopedia, https://www.investopedia.com).
How does the calculator work?
It sums cash, marketable securities and receivables, divides by daily cash expenses, and outputs your runway in days—no manual math.
What is a good DIR score?
Analysts flag scores above 120 days as comfortable for most industries; below 60 days signals tight liquidity (CFI, 2024).
How can I improve my DIR?
Increase liquid assets, speed up receivables, reduce discretionary spending, or refinance non-cash charges into longer-term debt.
Does DIR differ from the current ratio?
Yes. DIR measures time coverage of expenses, while the current ratio compares current assets to current liabilities (Brigham & Ehrhardt, 2022).
When should I recalculate?
Update after major cash movements, quarterly closes, or strategic planning sessions to keep decisions data-driven.
Can the DIR be negative?
No. If daily operational expenses exceed zero, liquid assets cannot be negative; a zero asset balance produces a zero DIR.
What data do I need?
Latest cash balance, marketable securities value, net receivables, annual operating costs and annual non-cash charges.
Important Disclaimer
The calculations, results, and content provided by our tools are not guaranteed to be accurate, complete, or reliable. Users are responsible for verifying and interpreting the results. Our content and tools may contain errors, biases, or inconsistencies. We reserve the right to save inputs and outputs from our tools for the purposes of error debugging, bias identification, and performance improvement. External companies providing AI models used in our tools may also save and process data in accordance with their own policies. By using our tools, you consent to this data collection and processing. We reserve the right to limit the usage of our tools based on current usability factors. By using our tools, you acknowledge that you have read, understood, and agreed to this disclaimer. You accept the inherent risks and limitations associated with the use of our tools and services.


