Data Segmentation Analysis
Is this tool helpful?
How to Use the Data Segmentation Analysis Tool Effectively
Follow these simple steps to get meaningful insights from your data using this tool:
- Specify your data segmentation criteria: Enter the specific factors you want to group your data by. For example, you might use “Customer engagement score, Subscription plan type, and Region” or “Device type, Session duration, and Traffic source”.
- Describe your dataset: Provide a concise overview of the dataset you want to analyze. Examples include “Online retail sales data containing product categories, sales figures, and customer demographics over 18 months” or “Mobile app usage logs with user IDs, event timestamps, and feature interactions”.
- Define your main analysis objective: Clearly state what you want to achieve with the segmentation. For example: “Identify high-churn user groups for retention efforts” or “Segment products with consistent sales decline to adjust inventory”.
- Choose your preferred programming language (optional): If you want a specific language for analysis, specify it here. Options include “Julia”, “Scala”, or “SAS”. If left blank, the default language is Python.
- Submit to generate your analysis: Click the button to process your inputs and receive a detailed segmentation report tailored to your dataset and goals.
After the tool completes the analysis, review the findings in the results section. You can copy the detailed insights easily to share or save for later use.
Data Segmentation Analysis: Definition, Purpose, and Benefits
Data segmentation analysis divides large datasets into smaller, meaningful groups that share common features or behaviors. This practice helps you understand your data better and make decisions based on distinct subgroups rather than the whole dataset.
What Is Data Segmentation Analysis?
It is the process of grouping data points into homogeneous segments based on specific criteria relevant to your goals. The aim is to cluster similar data while keeping groups meaningfully different from each other.
Why Perform Data Segmentation Analysis?
Segmenting your data uncovers insights hidden in aggregated views. You can:
- Identify distinct categories or groups within your dataset
- Understand unique features and behaviors of each segment
- Tailor strategies that fit each group’s characteristics
- Make smarter decisions focusing on relevant subsets
- Allocate resources more effectively to high-impact areas
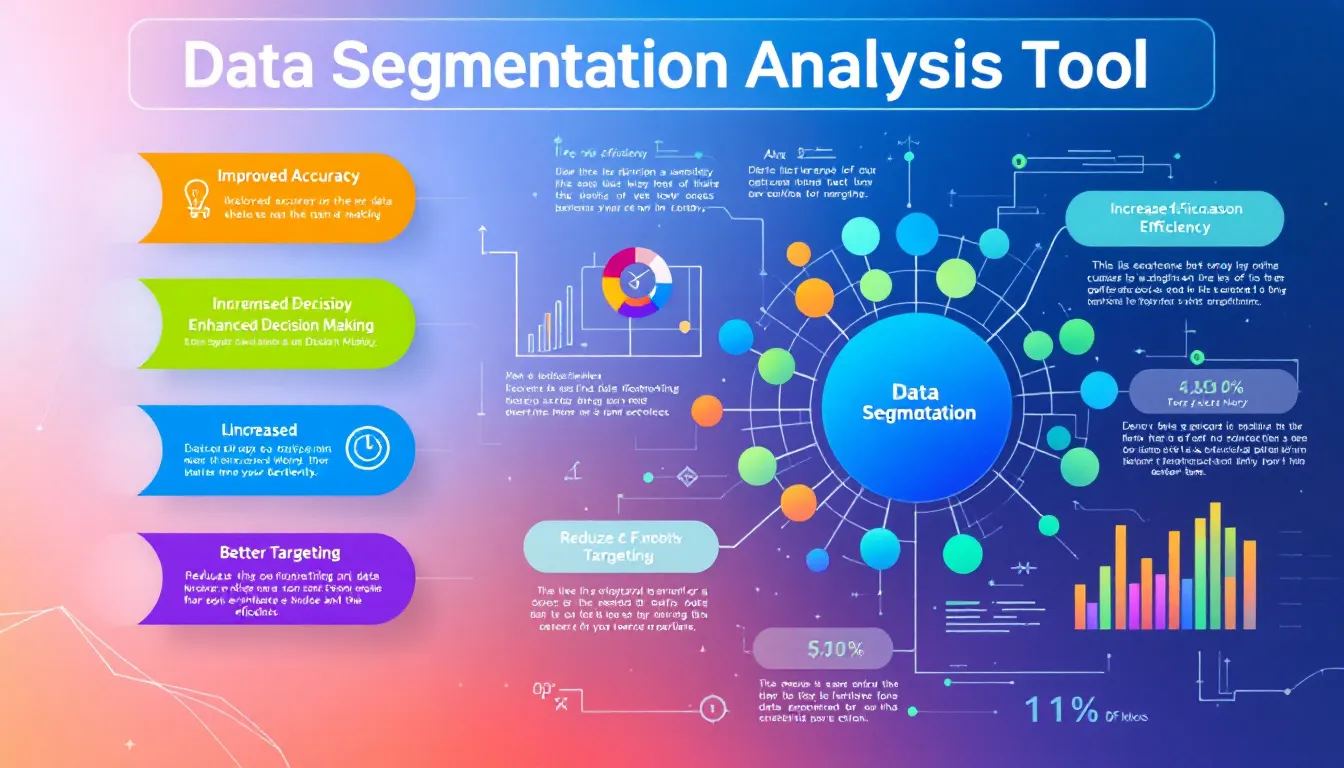
Key Benefits of Data Segmentation Analysis
- Better customer insights: Learn how different customer groups behave, enabling targeted marketing and improved engagement.
- Product or service customization: Discover needs of each segment to refine offerings.
- Efficient marketing campaigns: Deliver messages that resonate specifically with each group’s preferences.
- Optimized resource use: Focus efforts where they yield the highest return.
- Increased satisfaction and retention: Address distinct segment needs to boost loyalty.
- Informed data-driven decisions: Use actionable insights from segments for strategic planning.
- Competitive edge: Serve your audience better by understanding their differences.
Practical Uses of the Data Segmentation Analysis Tool
This tool helps analysts, marketers, and business professionals quickly generate detailed segmentation insights without deep coding expertise. Here’s how it solves common challenges:
1. Simplifying Complex Segmentation
This tool guides you to input your criteria and goals through a clear form, then performs the segmentation and analysis automatically. You avoid complicated manual coding or statistical procedures.
2. Flexible Segmentation Criteria
You control how you want to segment your data, whether by demographics, behavior, transactions, or other variables. The tool adapts to your inputs and supports multiple industries and use cases.
3. Actionable Segment Insights
Beyond grouping data, the tool describes each segment’s defining features, size, and potential implications to help you act on your findings.
4. Saves Time and Resources
Automation speeds up your analysis, letting you focus on strategy rather than data processing. It’s especially useful for teams that lack dedicated data science resources.
5. Programming Language Choice
While Python is the default for performing the analysis, you can pick other common languages like R, SQL, or Julia to fit your existing workflows.
Example Use Case: Market Segmentation for a Subscription Service
Consider a subscription service wanting to segment its users for personalized offers. Here’s how you might use the tool:
- Segmentation Criteria: Subscription tier, Last login date, Average session time
- Dataset Description: Six months of user activity and subscription data including engagement logs and payment history
- Analysis Objective: Identify at-risk subscribers to implement targeted retention campaigns
The tool might produce segments such as:
-
Active Premium Users (40% of users)
- Subscription tier: Premium
- Last login: Within 7 days
- Average session: 30+ minutes
-
At-Risk Basic Subscribers (25% of users)
- Subscription tier: Basic
- Last login: Over 30 days ago
- Average session: Less than 5 minutes
-
Occasional Mid-Tier Users (35% of users)
- Subscription tier: Mid-tier
- Last login: 8-30 days ago
- Average session: 10-29 minutes
With these segments, you can:
- Launch loyalty incentives for Active Premium Users to maintain engagement
- Send win-back emails and trial extensions to At-Risk Basic Subscribers
- Create feature tutorials targeted at Occasional Mid-Tier Users to boost usage
Common Industry Applications for Data Segmentation Analysis
This tool suits many fields where data segmentation unlocks deeper understanding and better targeting:
Retail and E-commerce
Use Case: Segment customers based on buying habits and demographics to personalize promotions, optimize inventory, and improve customer loyalty.
Example: Separate shoppers into “Frequent Buyers,” “Discount Seekers,” and “Seasonal Shoppers” groups to tailor messaging and offers.
Healthcare
Use Case: Group patients by risk factors, treatment history, or response to therapies to customize care plans and allocate resources effectively.
Example: Segment patients with chronic conditions into “Stable,” “Moderate Risk,” and “High Risk” to guide monitoring frequency and intervention.
Financial Services
Use Case: Categorize clients or investments by risk tolerance, portfolio characteristics, or income segments for better portfolio management and client communication.
Example: Identify “Conservative,” “Balanced,” and “Aggressive” investor groups to provide tailored advice and product offerings.
Marketing and Advertising
Use Case: Segment leads and customers to optimize campaign targeting, improve conversion rates, and allocate budgets efficiently.
Example: Separate audiences into “New Visitors,” “Repeat Buyers,” and “Lapsed Customers” and design campaigns specific to each.
Technology and SaaS
Use Case: Analyze user behavior and feature adoption to prioritize product development and tailor onboarding flows.
Example: Classify users into “Power Users,” “Occasional Users,” and “Churn Risks” to guide feature updates and retention programs.
Important Disclaimer
The calculations, results, and content provided by our tools are not guaranteed to be accurate, complete, or reliable. Users are responsible for verifying and interpreting the results. Our content and tools may contain errors, biases, or inconsistencies. Do not enter personal data, sensitive information, or personally identifiable information in our web forms or tools. Such data entry violates our terms of service and may result in unauthorized disclosure to third parties. We reserve the right to save inputs and outputs from our tools for the purposes of error debugging, bias identification, and performance improvement. External companies providing AI models used in our tools may also save and process data in accordance with their own policies. By using our tools, you consent to this data collection and processing. We reserve the right to limit the usage of our tools based on current usability factors.