Is this tool helpful?
How to Use the Data Analysis Expert Tool Effectively
Follow these steps to get the most out of the Data Analysis Expert Tool and uncover valuable insights from your data:
- Define Your Desired Outcome: Clearly describe the goal you want to achieve with your data analysis. For example, you could enter “Boost website conversion rates by 25%” or “Lower customer churn by 10% within six months.”
- Describe Your Data: Provide a summary of the dataset you want to analyze. Include the type of data, size, and key variables. Examples include “Employee performance metrics from last year, including hours worked, task completion rates, and feedback scores” or “Monthly social media engagement data covering likes, shares, comments, and follower demographics.”
- Specify Analysis Methods (Optional): If you prefer certain techniques or visualizations, list them here. You might write “Sentiment analysis, trend detection” or “Decision trees, heatmap visualization.”
- Identify Key Metrics (Optional): Highlight specific metrics or KPIs to focus on during analysis. Examples are “Average Response Time, Net Promoter Score” or “Bounce Rate, Customer Engagement Score.”
- Submit for Analysis: Click the “Analyze Data” button after completing the required sections and any optional inputs. The tool will process your data and generate insights based on your inputs.
- Review Results: Examine the analysis outcomes displayed, which include trends, correlations, and actionable recommendations.
- Copy Results (Optional): Use the “Copy to Clipboard” feature to save or share the insights easily.
What the Data Analysis Expert Tool Does and Why It Matters
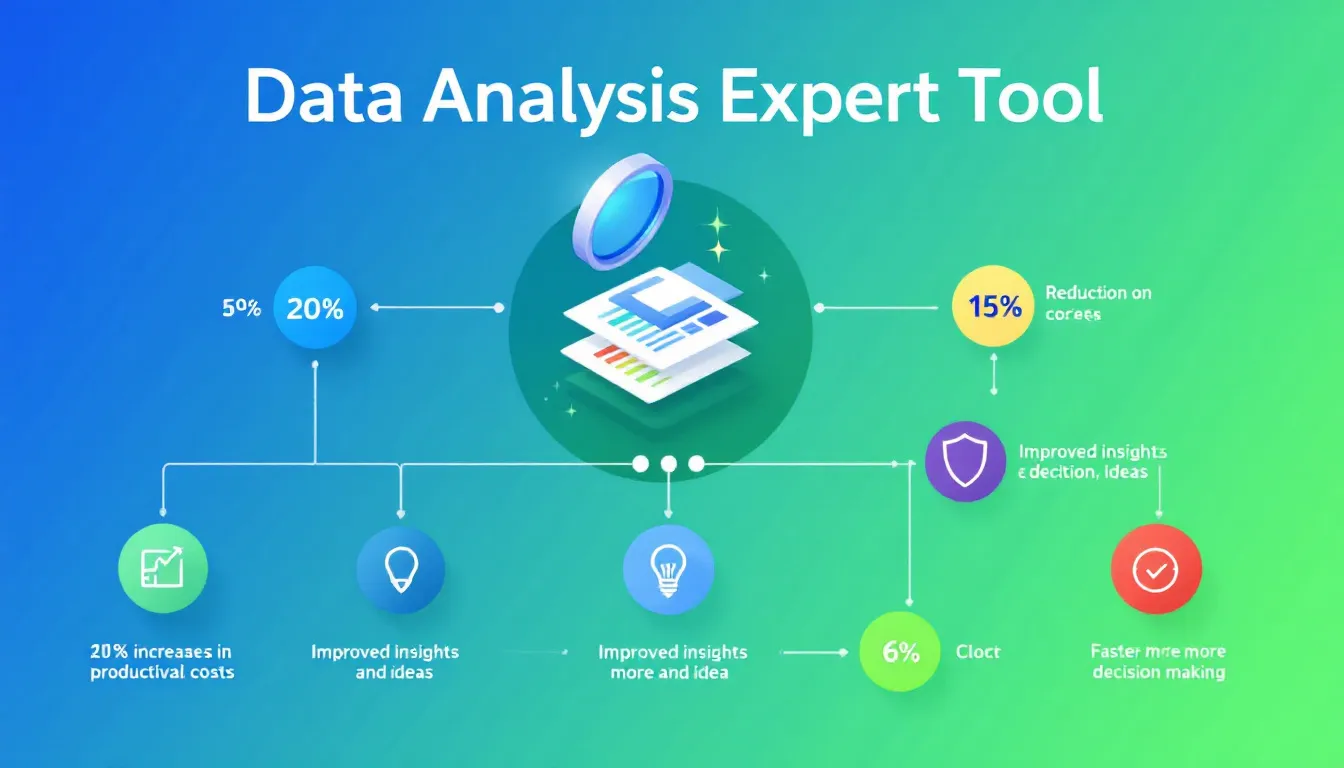
The Data Analysis Expert Tool helps you transform raw information into clear, data-driven insights that directly support your business goals. It uses statistical techniques, data visualization, and machine learning to analyze complex data quickly and accurately.
This tool benefits organizations by:
- Revealing hidden patterns and relationships in your data
- Predicting future trends and outcomes based on historical information
- Optimizing workflows and strategies using data-backed evidence
- Supporting decision-making with clear, actionable insights
- Helping you stay competitive in your industry by leveraging data effectively
Whether you work in marketing, finance, manufacturing, or healthcare, this tool simplifies the analysis process so you can focus on improving your business rather than wrestling with data.
Practical Applications for the Data Analysis Expert Tool
Here are some real-world ways you can use the tool to solve data analysis challenges:
1. Understanding Sales Drivers
If you want to know what factors most influence your sales, input your historical sales metrics and relevant variables like marketing spend or seasonal effects. The tool will run analyses such as multiple regression to highlight the main drivers of sales performance.
2. Segmenting Customers for Better Targeting
Use the tool to create customer segments by clustering data on purchase behavior, demographics, or engagement. This segmentation supports targeted marketing campaigns and personalized communication strategies.
3. Forecasting Demand to Manage Inventory
Analyze past sales trends along with external influences like market trends or economic signals to predict future product demand. These forecasts enable you to manage inventory more effectively, reducing costs and preventing stockouts.
4. Detecting Anomalies in Transactions
Leverage the tool’s machine learning capabilities to flag unusual or potentially fraudulent financial transactions by examining patterns in transaction amounts, frequency, and user behavior.
5. Optimizing Pricing for Revenue Growth
Input pricing data along with sales and competitor information to identify optimal pricing strategies. The tool helps balance revenue maximization with customer satisfaction by analyzing price elasticity and sales trends.
Key Benefits of the Data Analysis Expert Tool
Efficient Data Processing
The tool accelerates data analysis by automating complex statistical calculations and data handling tasks. This saves you time and frees your team to focus on strategy and decision-making.
Advanced Statistical Techniques
Use methods like:
- Regression analysis (e.g., linear, logistic)
- Time series forecasting $$\text{(e.g., }y_t = \alpha + \beta t + \epsilon_t\text{)}$$
- Cluster analysis for grouping data points
- Principal Component Analysis (PCA) for reducing dimensionality
- Hypothesis testing to determine statistical significance
This variety of methods allows you to explore your data from multiple angles and gain deeper insights.
Clear and Interactive Data Visualization
The tool generates charts and graphs such as heat maps, scatter plots, and trend lines that make it easier to understand complex data. These visualizations help you communicate findings to stakeholders effectively.
Customizable Inputs for Tailored Analysis
Adjust analysis methods, specify key metrics, and describe your data in detail to receive insights that align with your unique business challenges and objectives.
Scalable and Versatile Across Industries
From startups to large enterprises, the tool handles datasets of varying sizes and complexity. It supports industries such as healthcare, finance, manufacturing, marketing, and more.
Example Use Cases Highlighting the Data Analysis Expert Tool
Healthcare: Predict Patient Risk Factors
Analyze patient demographics, treatment histories, and outcomes to identify risk factors for hospital readmission. This helps design intervention programs that improve patient care and reduce costs.
E-commerce: Increase Customer Retention
Examine shopping behaviors, product preferences, and engagement data to create personalized recommendations. This approach boosts average order value and keeps customers coming back.
Manufacturing: Implement Predictive Maintenance
Use sensor and maintenance data to forecast equipment failures. Early identification of issues reduces downtime and lowers maintenance expenses.
Marketing: Improve Campaign Performance
Analyze channel performance data such as click-through and conversion rates to optimize budget allocation. Target high-performing segments to increase return on investment.
Important Disclaimer
The calculations, results, and content provided by our tools are not guaranteed to be accurate, complete, or reliable. Users are responsible for verifying and interpreting the results. Our content and tools may contain errors, biases, or inconsistencies. Do not enter personal data, sensitive information, or personally identifiable information in our web forms or tools. Such data entry violates our terms of service and may result in unauthorized disclosure to third parties. We reserve the right to save inputs and outputs from our tools for the purposes of error debugging, bias identification, and performance improvement. External companies providing AI models used in our tools may also save and process data in accordance with their own policies. By using our tools, you consent to this data collection and processing. We reserve the right to limit the usage of our tools based on current usability factors.
