Current Liability Coverage Ratio Calculator
Is this tool helpful?
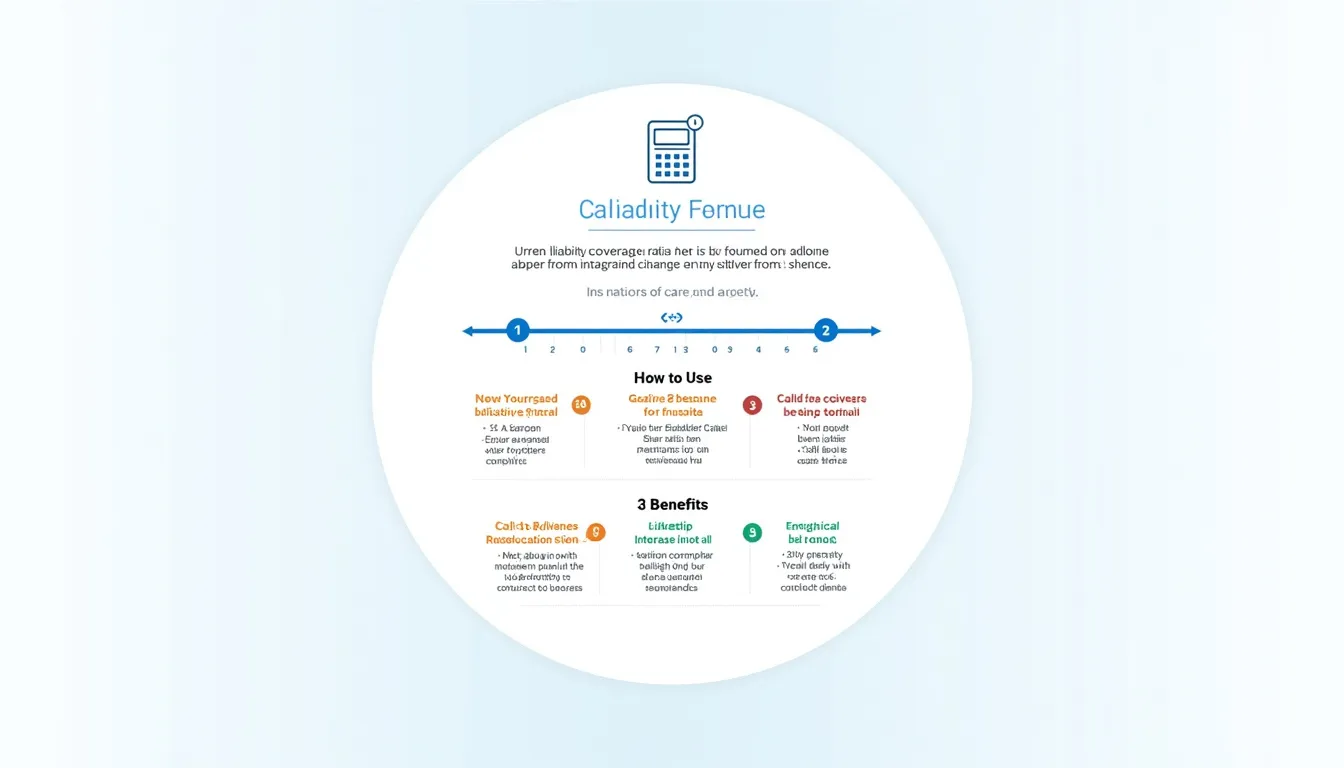
How to use the tool
- Enter Net Cash from Operating Activities: Type the figure from your latest cash-flow statement, e.g., 250 000 or 78 000.
- Enter Total Current Liabilities: Use the sum of all obligations due within 12 months, e.g., 500 000 or 195 000.
- Enter Number of Liabilities: Count each distinct current liability, e.g., 8 or 5.
- Press “Calculate”: The script divides total liabilities by the count to find the average, then divides net cash by that average to output your ratio.
Formulas the calculator uses
$$ \text{Average Current Liabilities}= rac{\text{Total Current Liabilities}}{\text{Number of Liabilities}} $$ $$ \text{Current Liability Coverage Ratio}= rac{\text{Net Cash from Operating Activities}}{\text{Average Current Liabilities}} $$
Example A
- Net Cash = 250 000 USD
- Total Liabilities = 500 000 USD
- Liability Count = 8
$$ \text{Average}= rac{500 000}{8}=62 500 $$ $$ \text{Ratio}= rac{250 000}{62 500}=4.00 $$
A value of 4 means your operations produce four dollars of cash for every liability dollar—excellent short-term liquidity.
Example B
- Net Cash = 78 000 USD
- Total Liabilities = 195 000 USD
- Liability Count = 5
$$ \text{Average}= rac{195 000}{5}=39 000 $$ $$ \text{Ratio}= rac{78 000}{39 000}=2.00 $$
At 2.00, you still generate twice the cash needed, indicating strong coverage.
Quick-Facts
- Median S&P 500 ratio: 1.4 × (S&P Global Market Intelligence, 2023).
- Target threshold ≥ 1.0 per CFA liquidity guidance (CFA Institute, 2022).
- Net cash defined under GAAP Statement of Cash Flows ASC 230 (FASB, 2021).
- SEC Rule 13a-13 mandates quarterly disclosure for U.S. issuers (SEC, 2021).
FAQ
What does the calculator measure?
It shows how many dollars of operating cash cover each dollar of average current liabilities, spotlighting near-term solvency (Investopedia, https://www.investopedia.com).
How do I compute average current liabilities?
Sum all current liabilities and divide by the number of separate obligations; the tool automates this step, preventing manual error (KPMG “Guide to Financial Statement Presentation,” 2023).
What is a healthy ratio?
Values above 1 indicate adequate cash generation; manufacturers average 1.3, while utilities average 0.9 (Moody’s sector medians 2022).
Why not rely on the current ratio instead?
The current ratio counts inventory and receivables that may not be quickly liquid, whereas this metric focuses solely on cash coming from operations (PwC, “Cash Flow Fundamentals,” 2022).
How frequently should I run the calculation?
Quarterly aligns with SEC filings, enabling trend spotting before annual reports (SEC Form 10-Q instructions, 2021).
Can a very high ratio be bad?
Excessive liquidity may signal under-investment; “idle cash erodes return on equity” (McKinsey & Company, Global Capital Survey 2022).
How can I raise a low ratio?
Boost operating cash by improving receivable collection, renegotiating supplier terms, or trimming discretionary spending (Harvard Business Review, “Managing Cash Flow,” 2021).
Does the tool work for startups?
Yes, but volatile cash flows can distort single-period results; supplement with cash-burn rate analysis (CB Insights, Startup Financials Report 2023).
Important Disclaimer
The calculations, results, and content provided by our tools are not guaranteed to be accurate, complete, or reliable. Users are responsible for verifying and interpreting the results. Our content and tools may contain errors, biases, or inconsistencies. We reserve the right to save inputs and outputs from our tools for the purposes of error debugging, bias identification, and performance improvement. External companies providing AI models used in our tools may also save and process data in accordance with their own policies. By using our tools, you consent to this data collection and processing. We reserve the right to limit the usage of our tools based on current usability factors. By using our tools, you acknowledge that you have read, understood, and agreed to this disclaimer. You accept the inherent risks and limitations associated with the use of our tools and services.
