CPI Calculator: Measure Inflation and Price Changes Over Time
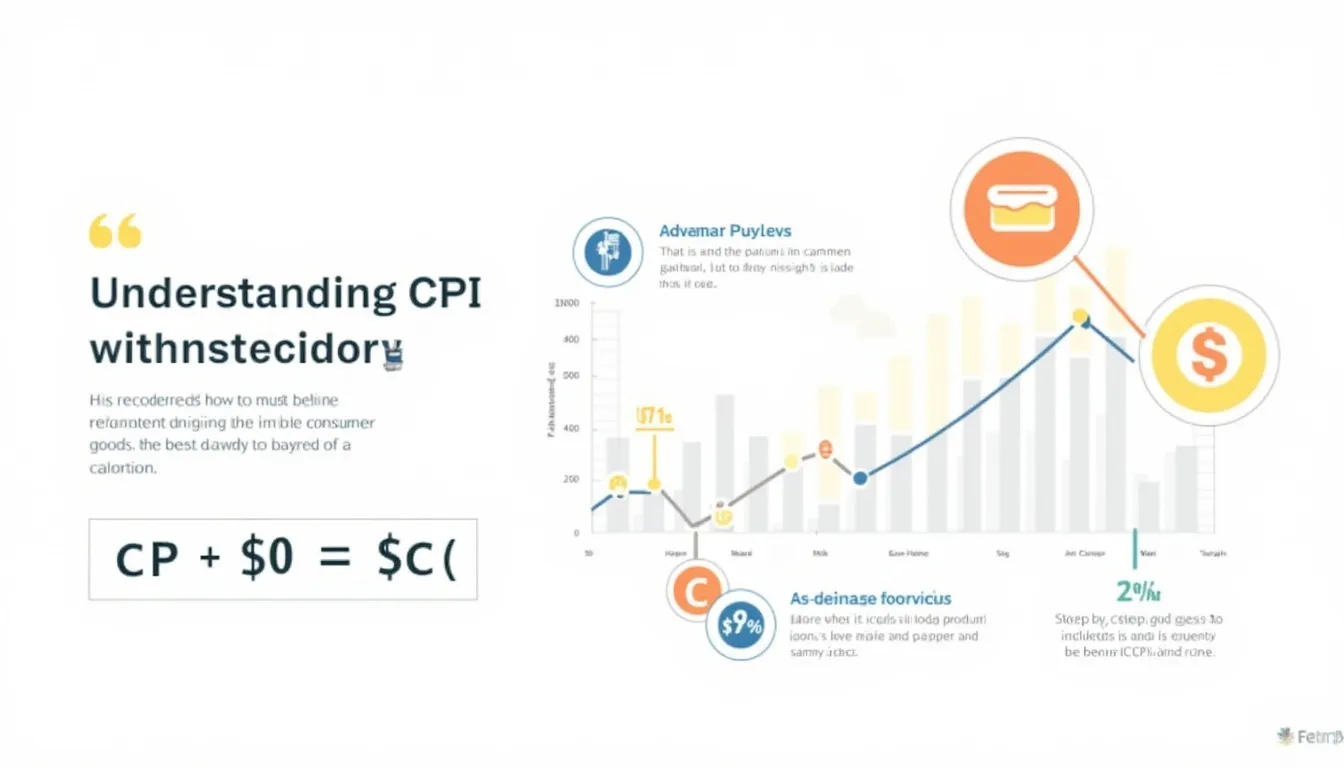
Use the CPI calculator by entering a base year (e.g., 1995), a current year (e.g., 2024) and each item’s quantity plus past-and-present prices; it returns Consumer Price Index and inflation rate. U.S. consumer prices rose 4.9 % year-over-year in April 2023 (BLS News Release, 2023).
CPI Calculator
Results
★ Add to Home Screen
×
Follow these steps:
Tap the Share button at the bottom of the browser
Scroll down and tap “Add to Home Screen”
Tap “Add” to confirm
Follow these steps:
Tap the menu icon (⋮) in the top right
Tap “Add to Home screen”
Tap “Add” to confirm
Follow these steps:
Click the menu icon (⋮) in the top right
Click “Bookmarks”
Click “Bookmark this tab” or press Ctrl+D (Cmd+D on Mac)
Is this tool helpful?
Thanks for your feedback!
How to use the tool
Choose a base year—the reference point for prices. Sample 1: 1998 Sample 2: 2012
Select the current year you want to compare. Sample 1: 2023 Sample 2: 2025
Add market-basket items:
Item name, e.g., Smartphone or Rice
Quantity, e.g., 1 unit or 50 kg
Base-year price, e.g., $600 or $0.80 / kg
Current-year price, e.g., $750 or $1.05 / kg
Add more items until the basket mirrors your spending.
Hit “Calculate”; the tool returns CPI, inflation rate, and a cost comparison chart.
Formulas used
Cost of basket in each year is the sum of quantity × price for every item.
Prices in your basket rose about 20 % between 2012 and 2021.
Quick-Facts
U.S. CPI covers roughly 93 % of the population (BLS CPI Handbook, bls.gov).
The index relies on about 80 000 price observations each month (BLS CPI Handbook, bls.gov).
Weights are updated every two years using consumer-expenditure data (BLS FAQ, bls.gov/cpi).
Headline CPI rose 4.9 % year-over-year in April 2023 (BLS News Release, 2023).
FAQ
What does a CPI value over 100 mean?
A CPI above 100 shows prices have risen since your base year; 120 means a 20 % increase (BLS Guide, bls.gov).
How is CPI different from PPI?
CPI tracks retail prices paid by consumers, while PPI measures wholesale prices received by producers (OECD Glossary, oecd.org).
Can I include services such as internet or rent?
Yes—CPI methodology treats services the same as goods: quantity × price for each year (BLS CPI Handbook, bls.gov).
Why use a personalized basket instead of official CPI?
Your spending pattern may differ from the national sample; a custom basket reveals your own cost-of-living change (IMF Toolkit, imf.org).
How many items should I enter for accuracy?
Include all categories exceeding 1 % of your monthly budget; small items have little impact (Federal Reserve EDU, federalreserve.gov).
What period gap is reasonable?
Most users compare 5-15 years to capture cyclical trends and policy shifts (World Bank Data Note, worldbank.org).
Is CPI adjusted for quality improvements?
Yes, the BLS applies hedonic adjustments to filter out quality changes in products like electronics (BLS Hedonic Paper, 2022).
Why does my result differ from official inflation?
Official CPI uses national weights; your basket’s weights and local prices create a unique index (BLS FAQ, bls.gov/cpi).
Important Disclaimer
The calculations, results, and content provided by our tools are not guaranteed to be accurate, complete, or reliable. Users are responsible for verifying and interpreting the results. Our content and tools may contain errors, biases, or inconsistencies. Do not enter personal data, sensitive information, or personally identifiable information in our web forms or tools. Such data entry violates our terms of service and may result in unauthorized disclosure to third parties. We reserve the right to save inputs and outputs from our tools for the purposes of error debugging, bias identification, and performance improvement. External companies providing AI models used in our tools may also save and process data in accordance with their own policies. By using our tools, you consent to this data collection and processing. We reserve the right to limit the usage of our tools based on current usability factors.


")


