Confidence Interval Calculator
Is this tool helpful?
How to use the tool
- 1. Choose Data Type. Pick Mean for numeric averages or Proportion for percentages.
- 2. Enter Sample Size. Type how many observations you collected (e.g., 40 or 250).
- 3. Add Your Data.
- Mean fields: sample mean and sample standard deviation; add population SD if known.
- Proportion field: sample proportion as a decimal (0 – 1).
- 4. Select Confidence Level. Choose 90 %, 95 %, or 99 %.
- 5. Press Calculate to see the interval, margin of error, and chart.
Example A (Proportion)
- Data type: Proportion
- Sample size: 250
- Sample proportion: 0.62
- Confidence level: 95 %
Example B (Mean)
- Data type: Mean
- Sample size: 40
- Sample mean: 9.5 h
- Sample SD: 1.2 h
- Confidence level: 99 %
Formulas
- Mean, σ known: $$\bar{x}\pm z_{α/2} rac{σ}{\sqrt{n}}$$
- Mean, σ unknown: $$\bar{x}\pm t_{α/2,n-1} rac{s}{\sqrt{n}}$$
- Proportion: $$\hat{p}\pm z_{α/2}\sqrt{ rac{\hat{p}(1-\hat{p})}{n}}$$
Quick-Facts
- 95 % intervals use z = 1.96 (NIST, 2023).
- Standard error halves when sample size quadruples (Frost, 2019).
- Valid normal-approximation needs n p ≥ 5 and n (1-p) ≥ 5 (Penn State STAT 414, 2022).
- Overlapping 95 % CIs can still hide significant differences (Scholl & Chiang, 2013).
FAQ
What is a confidence interval?
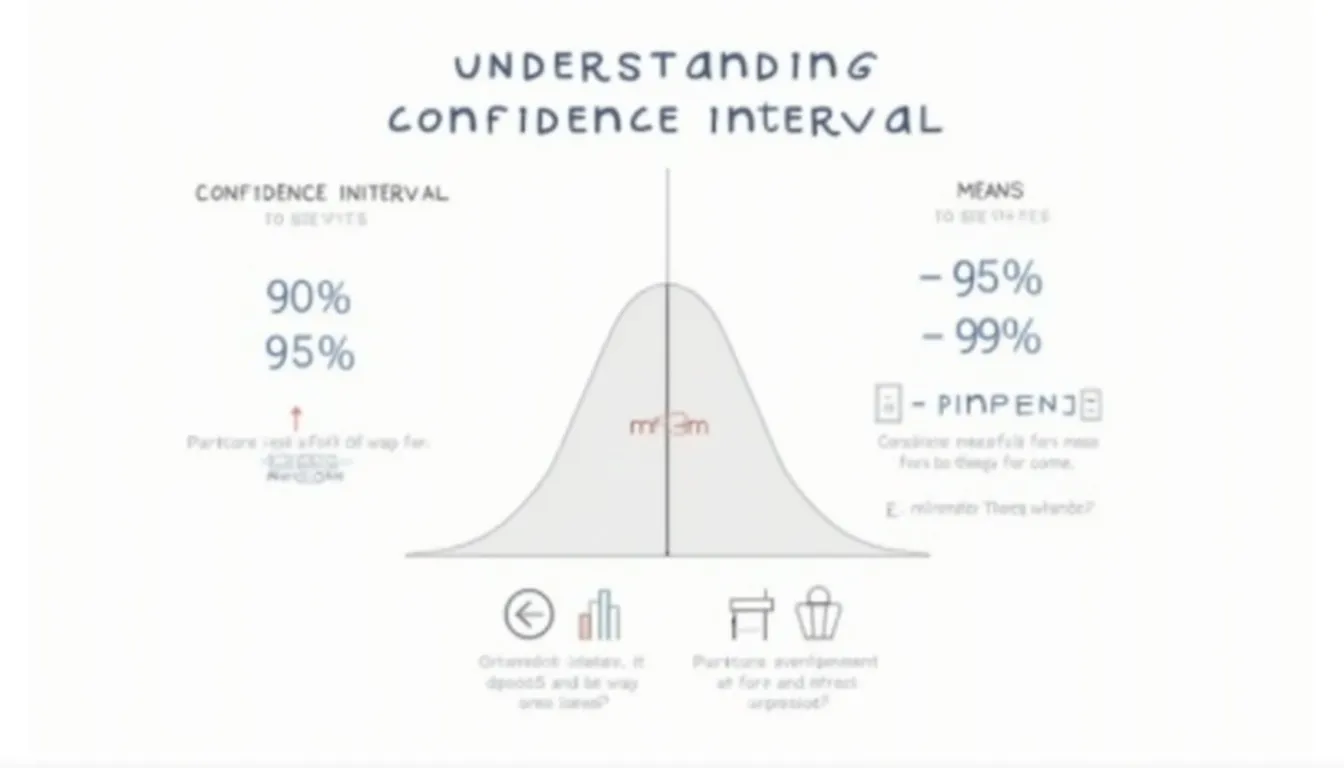
A confidence interval is a range that likely contains the true population parameter, based on sample data (Montgomery, 2020).
Why choose 95 % instead of 90 %?
95 % offers a balanced trade-off between precision and certainty; 90 % is narrower but riskier (Kutner, 2013).
How large should my sample be?
Ensure at least 30 observations for means or meet the n p rules for proportions to justify normal theory (NIST, 2023).
Which distribution should I use?
Use z when population SD is known or n ≥ 30; use t for smaller samples with unknown SD (Hayes, 2021).
How is margin of error calculated?
Multiply the critical value (z or t) by the standard error; this sets the half-width of the interval (NIST, 2023).
Can I test hypotheses with intervals?
Yes; if the hypothesised value lies outside the interval, reject the null at the chosen confidence level (Triola, 2022).
What if the interval crosses zero or one?
For means, crossing zero implies the parameter may be negative; for proportions, values below 0 or above 1 cap at the logical bounds (Agresti, 2018).
How do I narrow the interval?
Increase sample size, accept a lower confidence level, or reduce data variability with better measurement (Frost, 2019).
Important Disclaimer
The calculations, results, and content provided by our tools are not guaranteed to be accurate, complete, or reliable. Users are responsible for verifying and interpreting the results. Our content and tools may contain errors, biases, or inconsistencies. Do not enter personal data, sensitive information, or personally identifiable information in our web forms or tools. Such data entry violates our terms of service and may result in unauthorized disclosure to third parties. We reserve the right to save inputs and outputs from our tools for the purposes of error debugging, bias identification, and performance improvement. External companies providing AI models used in our tools may also save and process data in accordance with their own policies. By using our tools, you consent to this data collection and processing. We reserve the right to limit the usage of our tools based on current usability factors.


