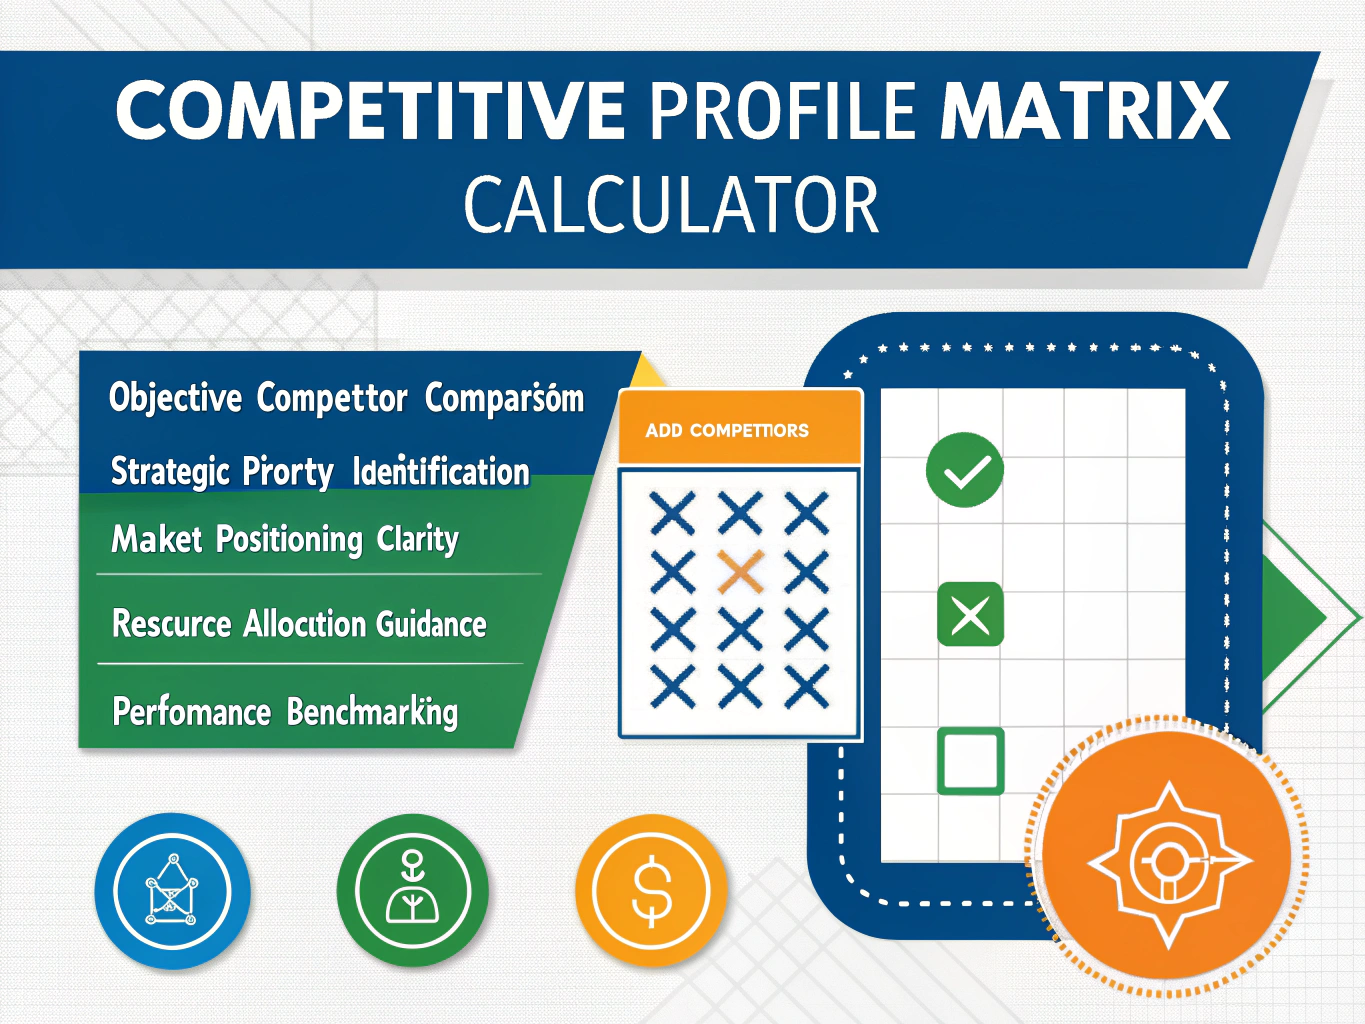
Competitive Profile Matrix Generator
Create a comprehensive competitive analysis by evaluating your company against competitors across critical success factors.
Choose the rating scale for evaluating competitors
Competitors
Enter your company name (the main subject of analysis)
Enter the name of your first competitor
Enter the name of your second competitor
Critical Success Factors
Enter a key factor that determines success in your industry
Assign importance weight (all weights should sum to 100%)
Enter a key factor that determines success in your industry
Assign importance weight (all weights should sum to 100%)
Enter a key factor that determines success in your industry
Assign importance weight (all weights should sum to 100%)
Click to create your competitive analysis matrix and charts
Warning: Weights do not sum to 100%
Current total: %. Please adjust weights or enable auto-normalization.
Competitive Profile Matrix
Results Summary
Competitive Analysis Charts
Total Scores Comparison
Competitive Profile Radar
Is this tool helpful?
How to use the tool
- List competitors
• Example 1: “Galaxy Gadgets Inc.”
• Example 2: “NovaTech Solutions” - Define critical success factors (CSFs)
• Example 1: “After-sales Service”
• Example 2: “Supply-chain Agility” - Assign a weight to each CSF so all weights sum to 100 %. • Example set: 20 %, 15 %, 10 %, 10 %, 45 % (total = 100 %).
- Select a rating scale. Choose 1-4 or 1-5. A higher number equals a stronger performance.
- Rate every firm on each CSF.
• Sample rating (1-5 scale): NovaTech on “Supply-chain Agility” = 4. - Click “Generate”. The matrix, bar chart and radar chart appear instantly. Use “Export CSV” to download the data.
Formulas
- Weighted score per factor $$\text{Score}_{ij}= rac{\text{Weight}_j}{100}\times \text{Rating}_{ij}$$ where i = company and j = CSF.
- Total score for a company $$\text{Total}_i=\sum_{j=1}^{n}\text{Score}_{ij}$$
- Auto-normalization (if checked) $$\text{Weight}_j^{*}= rac{\text{Weight}_j}{\sum_{k=1}^{n}\text{Weight}_k}\times100$$
Example calculation (1-4 scale)
Weights: Quality 25 %, Service 20 %, Agility 15 %, Brand 40 % (total = 100 %). Ratings for NovaTech: 3, 4, 2, 3.
- Quality: 0.25 × 3 = 0.75
- Service: 0.20 × 4 = 0.80
- Agility: 0.15 × 2 = 0.30
- Brand: 0.40 × 3 = 1.20
- Total score = 3.05/4.00
Quick-Facts
- Typical CPM uses 10-15 CSFs (David & David, Strategic Management, 2017).
- Weights must equal 100 % to keep scores comparable (Hitt et al., 2020).
- The 1-5 rating scale aligns with ISO 9004 performance levels (ISO 9004:2018).
- Firms update competitor ratings quarterly on average (McKinsey, Competitor Insights Report 2022).
Why use a Competitive Profile Matrix?
A CPM shows, in one view, where you overperform and where rivals lead, letting you allocate resources precisely. Strategy texts rank it among the “top five” diagnostic tools for industry analysis (David & David, 2017).
How do I choose critical success factors?
Select factors that influence buyer choice: cost, quality, innovation, distribution, brand. Porter says CSFs must be “both industry-specific and customer-relevant” (Porter, 1980).
What’s a good total score?
On a 1-5 scale, scores above 3.5 indicate strong competitive standing, while below 2.5 signals weakness (Hitt et al., 2020).
Can I compare different rating scales?
No. Mixing 1-4 and 1-5 scales distorts totals. Keep one scale per matrix for consistency (Strategic Management Insight, URL).
How often should I update weights?
Review weights whenever market priorities shift—usually annually or after major regulatory changes (Gartner, Market Trends 2023).
What if my weights don’t equal 100 %?
Enable auto-normalization. The tool rescales each weight using the formula above so the total equals 100 %, preventing calculation errors.
How is the radar chart useful?
The radar instantly highlights the largest performance gaps across factors, a visual cue for where strategic investment yields impact (McKinsey, 2022).
Can I export data for presentations?
Yes. Click “Export CSV” to download a comma-separated file compatible with Excel, Sheets and BI tools.
Important Disclaimer
The calculations, results, and content provided by our tools are not guaranteed to be accurate, complete, or reliable. Users are responsible for verifying and interpreting the results. Our content and tools may contain errors, biases, or inconsistencies. Do not enter personal data, sensitive information, or personally identifiable information in our web forms or tools. Such data entry violates our terms of service and may result in unauthorized disclosure to third parties. We reserve the right to save inputs and outputs from our tools for the purposes of error debugging, bias identification, and performance improvement. External companies providing AI models used in our tools may also save and process data in accordance with their own policies. By using our tools, you consent to this data collection and processing. We reserve the right to limit the usage of our tools based on current usability factors.


