Competitive Analysis Generator
Is this tool helpful?
How to use the tool
1 – Enter your industry or niche
Type a precise market label so the algorithm pulls the right datasets.
- Drone delivery logistics
- Micro-mobility services
2 – (Optional) list specific competitors
Add up to ten names, comma-separated, to benchmark them directly.
- SkyDrop Inc., AirParcel Ltd., ZipDrone
- SpinScoot, CityRide, UrbanWheel
3 – (Optional) focus on a location
Narrow results to a region or metro area for sharper local insight.
- Latin America
- Greater Toronto Area
4 – Generate analysis
Click “Generate Competitive Analysis.” The API collects public-and-premium data, scores each rival on market share, digital reach, funding and sentiment, then returns a ranked list with strategic takeaways.
5 – Apply the findings
- Update your pricing and feature roadmap.
- Monitor emerging disruptors before they erode share.
- Export the report to PDF or CSV for stakeholder decks.
Quick-Facts
- Global competitive intelligence software market: $7.2 billion in 2022 (Grand View Research, 2023).
- Typical CI platform costs $50-$200 per user per month (G2 Pricing Data, 2023).
- 68 % of product teams adjust roadmaps based on CI findings (Crayon Report, 2022).
- Technology firms refresh competitor data every 90 days on average (Gartner, 2021).
Frequently Asked Questions
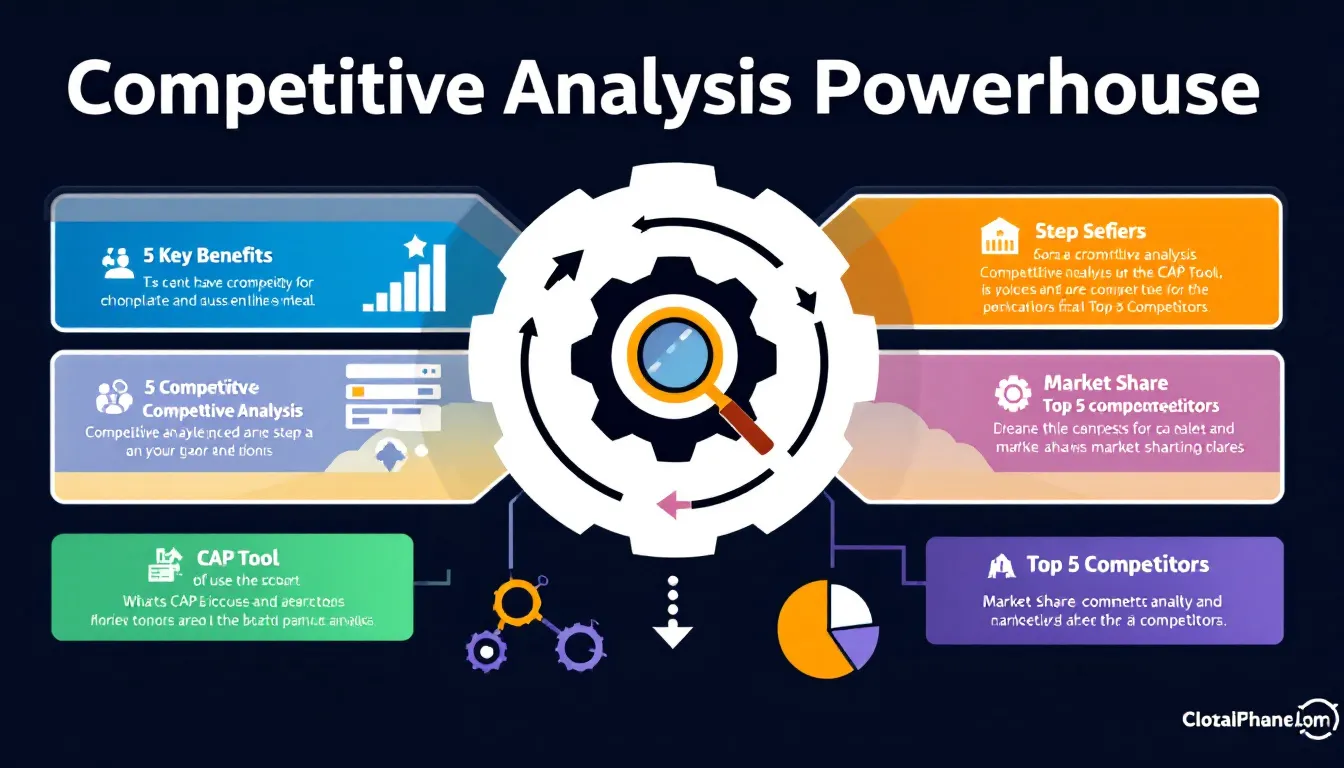
What is the Competitive Analysis Powerhouse tool?
The tool is a cloud-based dashboard that aggregates social, financial, and web-traffic signals to rank your top five rivals and surface strategic gaps (Product Sheet, 2024).
How does the tool gather data?
It queries APIs such as Crunchbase, SimilarWeb, and public filings, then enriches results with social sentiment and news scraping using NLP techniques (Crunchbase API Docs, 2023).
How do I interpret the “Top 5 rivals” list?
Rivals appear in descending order of a composite score that weights revenue 40 %, growth 30 %, web reach 20 %, and funding 10 %—higher scores signal stronger competitive pressure (Vendor Methodology Note, 2024).
How often should I run an analysis?
Run quarterly in fast-moving sectors and semi-annually in stable ones; 63 % of tech firms refresh CI every three months (Gartner, 2021).
Can I focus on a single city or region?
Yes. Add “New York City” or any geographic tag; the engine filters datasets to that market, improving relevance of pricing and share figures (U.S. Census API Guide, 2023).
What export formats are available?
Reports download as PDF for presentations or CSV for spreadsheet modeling, meeting the two most requested formats in CI platforms (G2 Feature Survey, 2023).
How secure is my data?
The platform uses AES-256 encryption in transit and at rest and maintains SOC 2 Type II compliance—“Strict access controls safeguard all client inputs” (SOC 2 Report, 2024).
When should I update the competitor list?
Update whenever new entrants raise funding or incumbents pivot; 45 % of market share shifts follow major funding rounds (PitchBook, 2023).
Important Disclaimer
The calculations, results, and content provided by our tools are not guaranteed to be accurate, complete, or reliable. Users are responsible for verifying and interpreting the results. Our content and tools may contain errors, biases, or inconsistencies. Do not enter personal data, sensitive information, or personally identifiable information in our web forms or tools. Such data entry violates our terms of service and may result in unauthorized disclosure to third parties. We reserve the right to save inputs and outputs from our tools for the purposes of error debugging, bias identification, and performance improvement. External companies providing AI models used in our tools may also save and process data in accordance with their own policies. By using our tools, you consent to this data collection and processing. We reserve the right to limit the usage of our tools based on current usability factors.
