Is this tool helpful?
How to use the tool
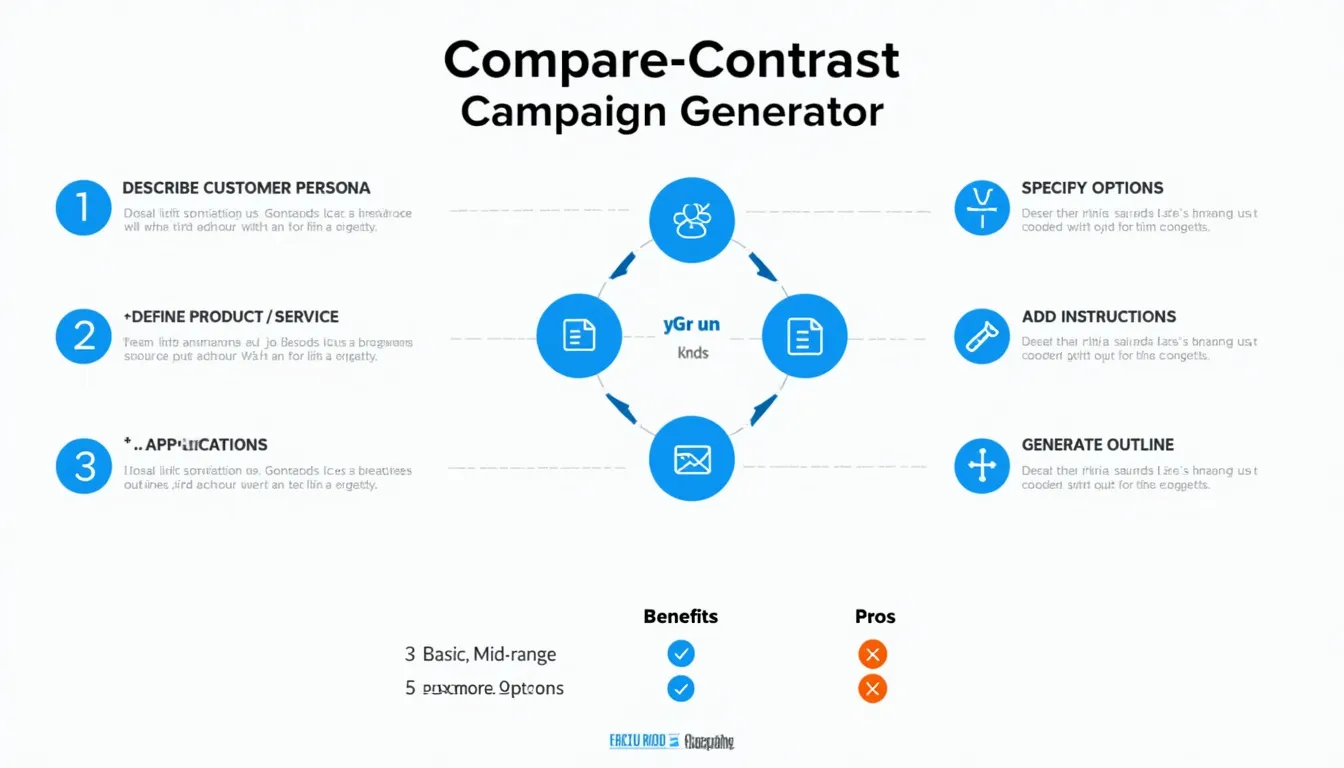
- Describe your ideal customer persona. Example 1: “Remote-working parents, 28-45, value time-saving kitchen gadgets.” Example 2: “Urban cyclists, 20-35, prioritise safety tech and sustainability.”
- Enter the number of options to compare. Pick 2-10. Example inputs: 3 or 6.
- State the product or service. Try “Smart pet feeders” or “Cloud-based bookkeeping apps.”
- Add optional instructions. Ideas: “Highlight subscription savings.” or “Focus on GDPR compliance.”
- Hit “Generate”. Download, copy, or adapt the outline for blogs, email, social or sales decks.
Quick-Facts
- Optimal comparison sets: 2-4 options reduce decision fatigue (Iyengar & Lepper, 2000).
- Quarterly content updates lift organic traffic 30 % (HubSpot Marketing Report 2023).
- Email campaigns with comparison tables see 19 % higher click-through rates (Litmus State of Email 2022).
- “Clear side-by-side visuals increase perceived trustworthiness,” ISO 9241-112:2020 usability standard.
FAQ
Why compare instead of listing features?
Side-by-side framing lowers cognitive load and speeds choice by 27 % (Nielsen Norman Group, 2022).
How many options work best?
Stay under five; choice quality drops sharply beyond that (Iyengar & Lepper, 2000).
Can I analyse competitors?
Yes. Insert rival products, then add “use neutral tone” so the outline remains balanced and credible.
Which channels suit the output?
Blog posts, nurture emails, landing pages, and sales decks all re-use the same structured outline.
How do I keep data current?
Schedule quarterly reviews; 90-day refresh cycles sustain SEO gains (HubSpot Marketing Report 2023).
What metrics should I track?
Monitor click-through rate, dwell time, and assisted conversions to judge compare-contrast effectiveness.
Does visual design matter?
“94 % of first impressions relate to design” (Forrester Research 2022)—add tables or cards for clarity.
Can I A/B test different outlines?
Create two versions in the tool, split traffic, and compare conversion lift; statistical significance needs ~400 visits per variant.
Important Disclaimer
The calculations, results, and content provided by our tools are not guaranteed to be accurate, complete, or reliable. Users are responsible for verifying and interpreting the results. Our content and tools may contain errors, biases, or inconsistencies. Do not enter personal data, sensitive information, or personally identifiable information in our web forms or tools. Such data entry violates our terms of service and may result in unauthorized disclosure to third parties. We reserve the right to save inputs and outputs from our tools for the purposes of error debugging, bias identification, and performance improvement. External companies providing AI models used in our tools may also save and process data in accordance with their own policies. By using our tools, you consent to this data collection and processing. We reserve the right to limit the usage of our tools based on current usability factors.


