Capitalization Rate Calculator
Is this tool helpful?
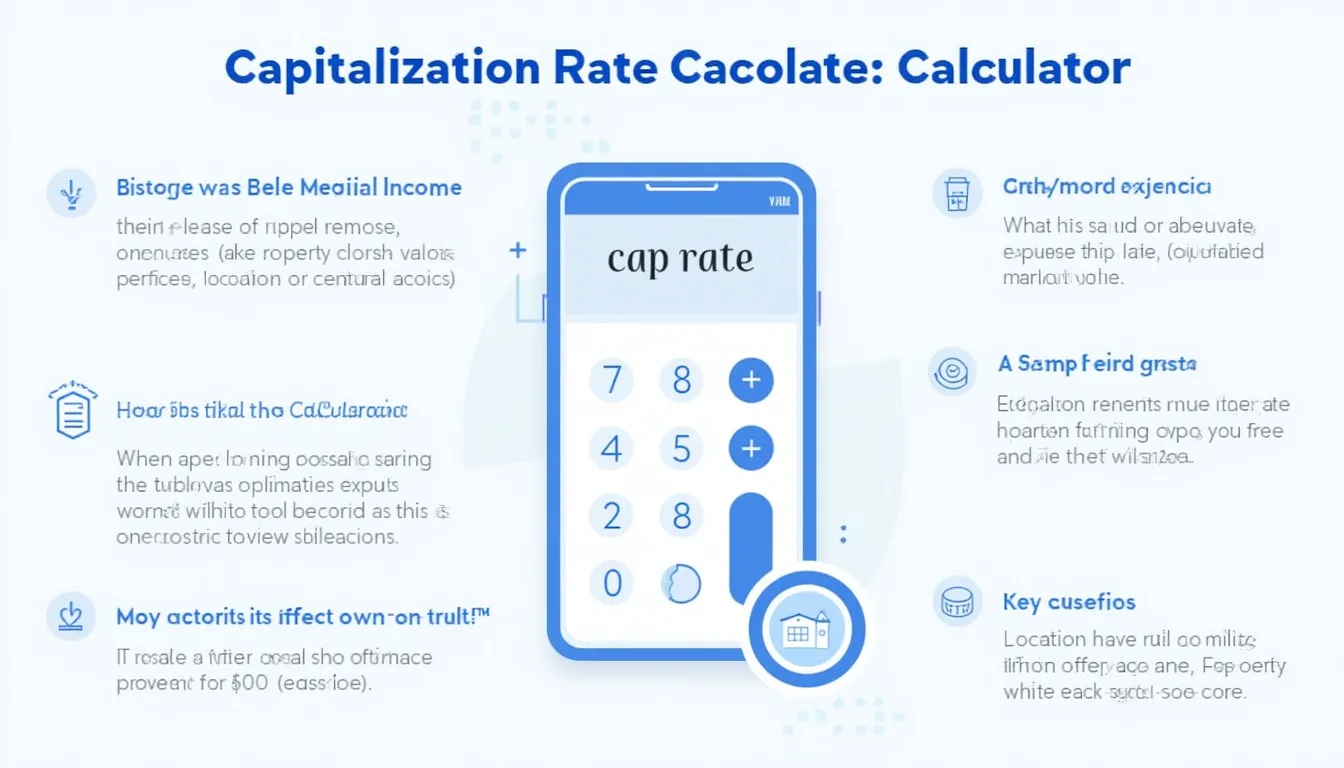
How to use the tool
- Annual Rental Income ($): Key in the gross rent collected over one year—try 21 600 or 38 400.
- Annual Amenities Income ($): Add extras such as parking or laundry fees—e.g., 1 250 or 2 050.
- Annual Property Management Costs ($): Include management, repairs, and maintenance—sample values 2 300 or 4 800.
- Annual Property Taxes ($): Enter the yearly tax bill—use 3 200 or 5 600.
- Annual Insurance Costs ($): Insert total insurance premiums—try 1 450 or 2 200.
- Current Market Value ($): Input today’s estimated price—such as 275 000 or 1 400 000.
- Calculate: Press the button to view Annual Income, Expenses, Net Operating Income, and Capitalization Rate.
Formulas used
- $$\text{Annual Income}= \text{Rental Income}+ \text{Amenities Income}$$
- $$\text{Annual Expenses}= \text{Property Management}+ \text{Property Taxes}+ \text{Insurance}$$
- $$\text{NOI}= \text{Annual Income}- \text{Annual Expenses}$$
- $$\text{Cap Rate}= rac{\text{NOI}}{\text{Market Value}}\times100\%$$
Example 1
- Rental Income: 22 000
- Amenities: 1 400
- Management: 2 100
- Taxes: 2 900
- Insurance: 1 350
- Market Value: 275 000
$$\text{Income}=22 000+1 400=23 400$$
$$\text{Expenses}=2 100+2 900+1 350=6 350$$
$$\text{NOI}=23 400-6 350=17 050$$
$$\text{Cap Rate}= rac{17 050}{275 000}\times100\%=6.20\%$$
Example 2
- Rental Income: 105 000
- Amenities: 6 000
- Management: 10 000
- Taxes: 9 500
- Insurance: 5 000
- Market Value: 1 400 000
$$\text{Income}=105 000+6 000=111 000$$
$$\text{Expenses}=10 000+9 500+5 000=24 500$$
$$\text{NOI}=111 000-24 500=86 500$$
$$\text{Cap Rate}= rac{86 500}{1 400 000}\times100\%=6.18\%$$
Quick-Facts
- Typical U.S. multifamily cap rates: 4 %-7 % (CBRE Cap Rate Survey, 2023).
- Commercial property management costs average 8 %-12 % of gross rent (BiggerPockets, 2022).
- Cap rate excludes mortgage payments—only operational income and expenses (Investopedia, 2023).
- Cap rates rose about 40 bps in 2022 as interest rates climbed (Moody’s Analytics, 2023).
FAQ
What is a capitalization rate?
The cap rate shows yearly return from operations by dividing net operating income by market value, ignoring financing (Investopedia, 2023).
What counts as a good cap rate?
Between 4 % and 10 % balances return and risk; dense urban assets sit near 4 %, secondary markets closer to 10 % (CBRE, 2023).
How can I estimate value from cap rate?
Rearrange the formula: $$\text{Value}= rac{\text{NOI}}{\text{Cap Rate}}$$; appraisers use local market cap rates for benchmarks (Appraisal Institute, 2020).
Can cap rate be negative?
Yes. If expenses exceed income, NOI turns negative, producing a negative cap rate and signaling a loss (IRS Publication 535, 2022).
How often should I recalculate it?
Update annually or after meaningful shifts in rent, expenses, or market value to keep performance metrics current (HUD, 2021).
Does debt influence cap rate?
No. Cap rate ignores loan terms; metrics that include financing are ROI or cash-on-cash return (Fitch Ratings, 2022).
How does location affect cap rate?
Prime cities show lower cap rates due to stable demand, whereas tertiary markets offer higher rates for additional risk (NAR Commercial Trends, 2023).
Cap rate vs. cash-on-cash return?
Cap rate uses property value; cash-on-cash compares annual pre-tax cash flow to cash invested, focusing on leveraged outcomes (Marcus & Millichap, 2022).
Important Disclaimer
The calculations, results, and content provided by our tools are not guaranteed to be accurate, complete, or reliable. Users are responsible for verifying and interpreting the results. Our content and tools may contain errors, biases, or inconsistencies. Do not enter personal data, sensitive information, or personally identifiable information in our web forms or tools. Such data entry violates our terms of service and may result in unauthorized disclosure to third parties. We reserve the right to save inputs and outputs from our tools for the purposes of error debugging, bias identification, and performance improvement. External companies providing AI models used in our tools may also save and process data in accordance with their own policies. By using our tools, you consent to this data collection and processing. We reserve the right to limit the usage of our tools based on current usability factors.
