BMR Calculator
Is this tool helpful?
How to use the tool
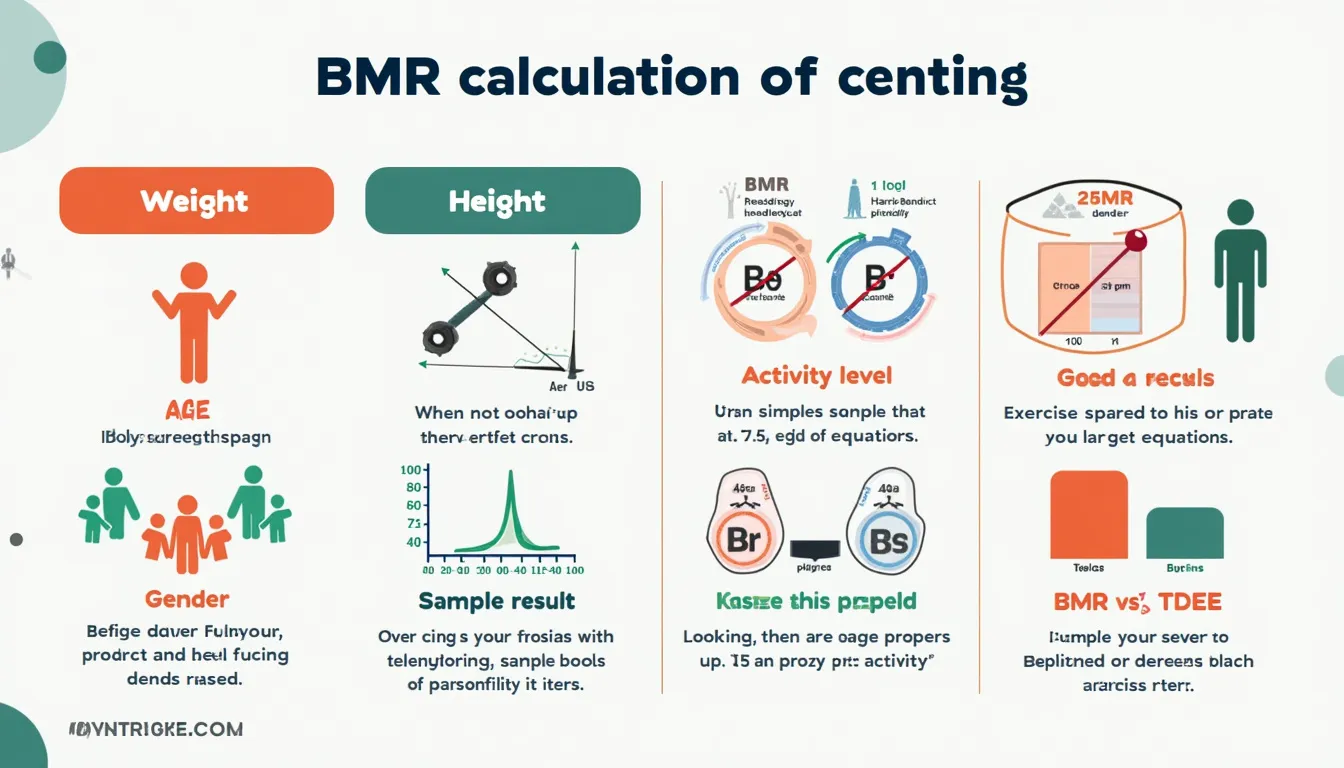
- Weight (kg): type, for example, 73.2 kg or 91.4 kg. Range 1–500.
- Height (cm): enter 169 cm or 192 cm. Range 50–300.
- Age (years): add 26 or 47. Range 1–120.
- Activity factor: pick 1.375 (Lightly Active) or 1.725 (Very Active).
- Model: choose Harris & Benedict or Black et al.
- Gender: select male or female, then press “Calculate”.
Formulas applied
- Harris & Benedict (weight W kg, height H m, age A y)
Men: $$BMR = 13.707W + 492.3H – 6.673A + 77.607$$ Women: $$BMR = 9.740W + 172.9H – 4.737A + 667.051$$ - Black et al.
Men: $$BMR = 259\,W^{0.48} H^{0.50} A^{-0.13}$$ Women: $$BMR = 230\,W^{0.48} H^{0.50} A^{-0.13}$$ - The chosen activity factor (1.2–1.9) scales BMR to daily energy needs.
Example calculations
- Male 80 kg, 180 cm, 35 y, 1.55, H&B:
Raw BMR = 1826.75 kcal → Daily need = 1826.75 × 1.55 ≈ 2831 kcal. - Female 65 kg, 170 cm, 29 y, 1.375, B&al:
Raw BMR ≈ 1432 kcal → Daily need ≈ 1432 × 1.375 ≈ 1970 kcal.
Quick-Facts
- BMR uses 60–75 % of daily calories (FAO/WHO/UNU, 2004).
- Harris–Benedict first published in 1919 (Harris & Benedict, 1919).
- Activity factors 1.2–1.9 follow ACSM guidelines (ACSM, 2018).
- 100 kcal daily surplus may add ≈5 kg/year (Hall et al., 2012).
What is BMR?
BMR is the energy your body needs at complete rest to fuel vital functions such as breathing and cell repair (FAO/WHO/UNU, 2004).
How does the calculator account for activity?
It multiplies the resting BMR by standard factors—1.2 for sedentary up to 1.9 for extra-active—recommended by sports-medicine authorities (ACSM, 2018).
Which formula should you choose?
Harris–Benedict is well-validated for general adults; Black et al. performs better in diverse ethnic groups (Black et al., 1996).
How often should you recalculate?
Update BMR after every 2–3 kg weight change or yearly, whichever comes first (Academy of Nutrition and Dietetics, 2020).
Can strength training raise BMR?
Yes. Twelve weeks of resistance exercise increased resting metabolism by about 7 % in older adults (Hunter et al., 2000).
Does age lower BMR?
Resting metabolic rate declines roughly 1–2 % each decade after 20 years (Roberts & Dallal, 2005). “Resting metabolic rate decreases with age independently of body composition” (Roberts & Rosenberg, 2006).
Important Disclaimer
The calculations, results, and content provided by our tools are not guaranteed to be accurate, complete, or reliable. Users are responsible for verifying and interpreting the results. Our content and tools may contain errors, biases, or inconsistencies. We reserve the right to save inputs and outputs from our tools for the purposes of error debugging, bias identification, and performance improvement. External companies providing AI models used in our tools may also save and process data in accordance with their own policies. By using our tools, you consent to this data collection and processing. We reserve the right to limit the usage of our tools based on current usability factors. By using our tools, you acknowledge that you have read, understood, and agreed to this disclaimer. You accept the inherent risks and limitations associated with the use of our tools and services.
