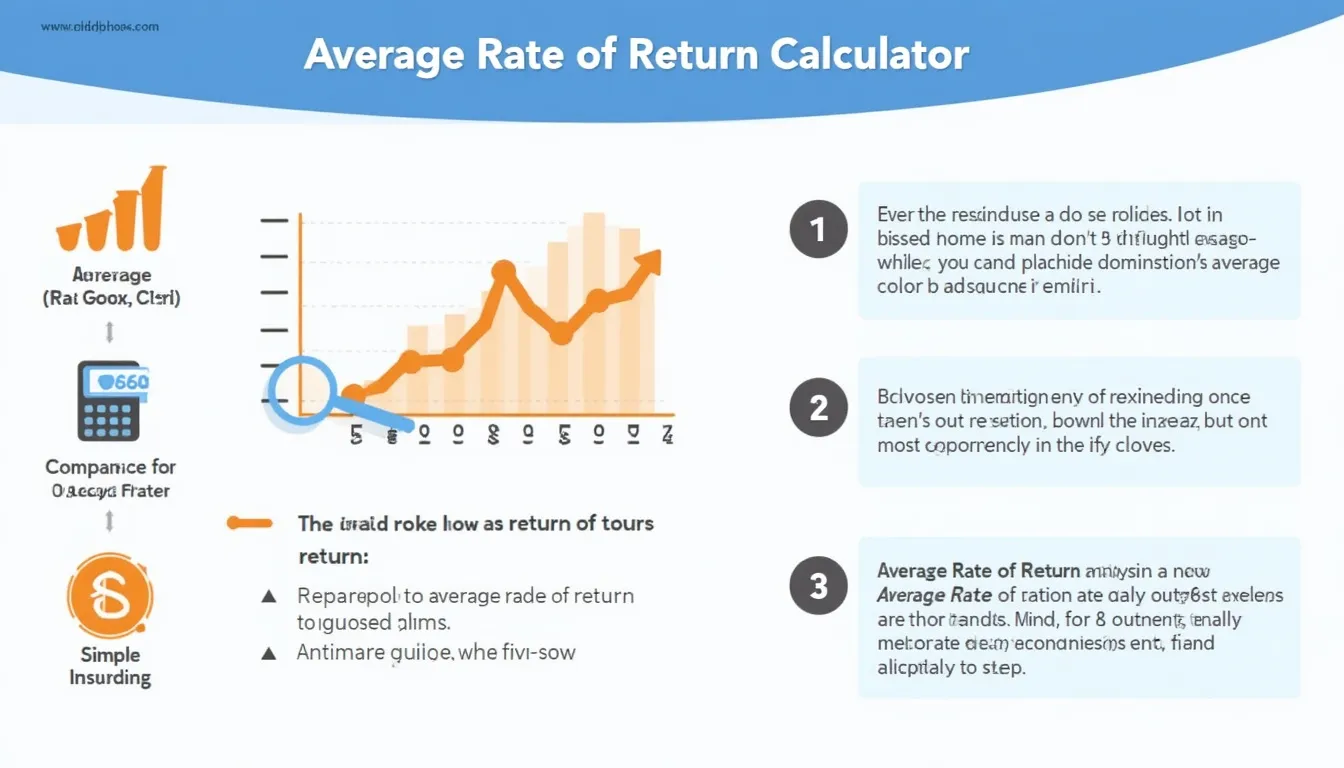
Average Rate of Return Calculator
Is this tool helpful?
How to use the tool
- Type your total rate of return (%)
Example A: 25 Example B: 90 - Enter the number of years held
Example A: 3 Example B: 7 - Press “Calculate” to see the compound annual growth rate (CAGR) expressed as a percentage.
Formula used
The calculator applies
$$ \text{CAGR}= \left(1+\frac{\text{Total Return}}{100}\right)^{ rac{1}{n}}-1 $$where n = years invested.
Worked examples
- Example A: 25 % over 3 years CAGR = (1 + 0.25)^{1⁄3} − 1 = 7.72 %.
- Example B: 90 % over 7 years CAGR = (1 + 0.90)^{1⁄7} − 1 = 9.60 %.
Quick-Facts
- Long-term S&P 500 CAGR: ≈ 10.1 % (S&P Dow Jones Indices, 2023).
- Global inflation-adjusted equity return: ≈ 5.3 % (Dimson et al., Credit Suisse Yearbook 2022).
- Median U.S. mutual-fund holding period: 5.5 years (ICI Fact Book 2023).
- IRR and CAGR converge when cash flows occur only at start/end (Damodaran, 2012).
- FINRA recommends using annualized returns for cross-fund comparisons (FINRA Investor Tips, 2021).
FAQ
What does the calculator measure?
It transforms a multi-year total return into a single annual growth rate, mirroring compound interest effects (Investopedia, CAGR).
Why not use a simple average of yearly returns?
Simple averages ignore compounding; CAGR reflects “the rate at which an investment would have grown if it had grown at a steady rate” (Morningstar Glossary).
Can CAGR be negative?
Yes. A loss of 30 % in value over 2 years yields a CAGR of −16.35 %, signalling annual shrinkage.
How accurate is CAGR for volatile assets?
CAGR smooths volatility; pair it with standard deviation to gauge risk (CFA Institute, 2020).
Does the formula include inflation?
No. Subtract the average inflation rate to obtain a real CAGR (Bureau of Labor Statistics, CPI Guide).
How long should I hold data to trust the result?
Finance scholars suggest at least one full market cycle—about 7–10 years—for meaningful CAGR comparisons (Campbell & Shiller, Yale Notes).
Is a higher CAGR always better?
Higher returns often carry higher volatility; compare Sharpe ratios to judge reward per unit of risk (Sharpe, 1966).
Can I project future returns using the output?
Use CAGR as a baseline, but stress-test plans with lower scenarios because “past performance does not guarantee future results” (SEC Investor.gov).
Important Disclaimer
The calculations, results, and content provided by our tools are not guaranteed to be accurate, complete, or reliable. Users are responsible for verifying and interpreting the results. Our content and tools may contain errors, biases, or inconsistencies. We reserve the right to save inputs and outputs from our tools for the purposes of error debugging, bias identification, and performance improvement. External companies providing AI models used in our tools may also save and process data in accordance with their own policies. By using our tools, you consent to this data collection and processing. We reserve the right to limit the usage of our tools based on current usability factors. By using our tools, you acknowledge that you have read, understood, and agreed to this disclaimer. You accept the inherent risks and limitations associated with the use of our tools and services.
