Asset to Sales Ratio Calculator
Is this tool helpful?
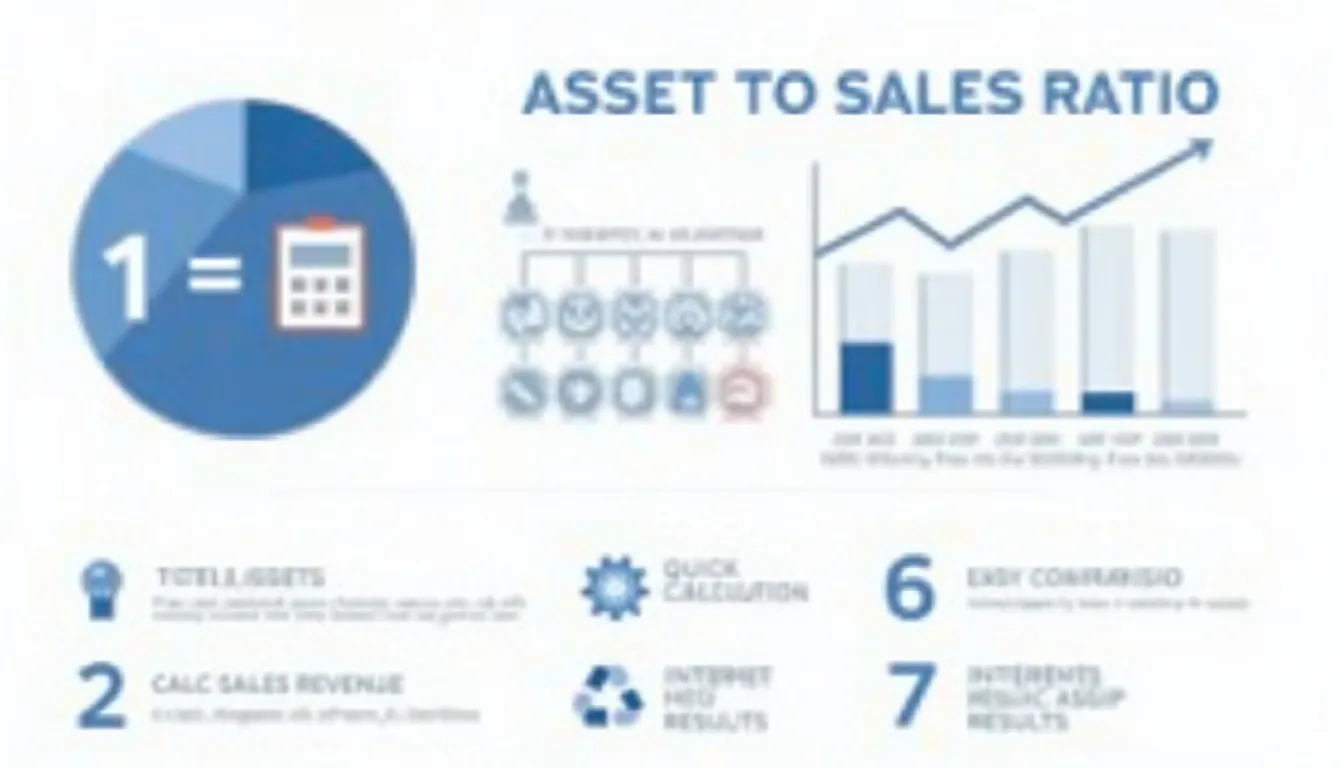
How to Use the Asset to Sales Ratio Calculator Effectively
The Asset to Sales Ratio Calculator is designed to help you quickly and accurately evaluate how efficiently a business uses its assets to generate sales revenue. Follow these straightforward steps to make the most of this financial tool:
-
Total Assets: Enter the total value of a company’s assets in dollars. This includes everything from cash, inventory, and accounts receivable to property, equipment, and other long-term assets.
Example: 2,500,000 or 8,750,000 -
Sales Revenue: Input the total sales revenue the company has generated over a specific period, usually a fiscal year, expressed in dollars.
Example: 5,000,000 or 12,000,000 - Calculate: Click the calculate button to instantly receive the Asset to Sales Ratio.
- Interpret the Result: The displayed ratio reveals how much asset value is used to generate each dollar of sales, providing insight into operational efficiency.
Using precise inputs ensures reliable results that can inform critical business decisions, investor evaluations, and financial assessments.
Introduction to the Asset to Sales Ratio Calculator: Definition, Purpose, and Key Benefits
The Asset to Sales Ratio Calculator is an essential financial analysis tool used to measure a company’s efficiency in using its assets to produce sales revenue. This metric, often called the Total Asset Turnover Ratio, offers valuable insights into business performance by showing the relationship between asset values and generated sales.
This ratio is calculated as follows:
$$ \text{Asset to Sales Ratio} = \frac{\text{Total Assets}}{\text{Sales Revenue}} $$
A lower Asset to Sales Ratio typically signals better asset utilization, meaning the company is generating higher sales with fewer assets. Conversely, a higher ratio could indicate underperformance or asset underuse, signaling areas for operational improvement.
Key Benefits of Using This Asset to Sales Ratio Calculator
- Fast & Accurate Results: Eliminate manual errors and save time with instant, precise calculations.
- Benchmarking & Comparison: Easily compare asset efficiency across different companies or time periods for better analysis.
- Informed Decision-Making: Gain actionable insights for investors, managers, and analysts to optimize asset use.
- Performance Tracking: Monitor operational efficiency over time to identify trends and improvement areas.
- Optimized Resource Allocation: Assess whether assets are effectively deployed or if reallocation is needed.
Example Calculations with the Asset to Sales Ratio Calculator
Here are practical examples demonstrating how the Asset to Sales Ratio Calculator helps analyze business efficiency:
Example 1: Technology Company Evaluation
- Total Assets: $3,200,000
- Sales Revenue: $8,000,000
Using the formula:
$$ \frac{3,200,000}{8,000,000} = 0.40 $$
This means the company uses $0.40 of assets to generate each dollar of sales, indicating strong asset efficiency.
Example 2: Manufacturing Firm’s Performance
- Total Assets: $15,000,000
- Sales Revenue: $10,000,000
Calculation:
$$ \frac{15,000,000}{10,000,000} = 1.50 $$
A ratio of 1.50 suggests the firm holds more assets relative to sales, which may signal inefficiencies or capital intensity, often typical in manufacturing.
Interpretation Tips
- A ratio lower than 1 generally reflects effective asset utilization.
- Sector and industry norms influence what is considered a “good” ratio.
- Changes over time in this ratio reveal trends in operational effectiveness.
Who Should Use the Asset to Sales Ratio Calculator?
Investors and Financial Analysts
- Evaluate company efficiency to identify sound investments and spot risks.
- Compare multiple companies’ operational performance within industries.
- Track efficiency trends over fiscal periods.
Business Owners and Managers
- Monitor and improve asset utilization.
- Identify underperforming assets or areas of overinvestment.
- Set realistic operational goals based on quantitative data.
Accountants and Financial Professionals
- Streamline client financial analysis with consistent calculations.
- Generate accurate reports that align with best practices.
- Advise clients on improving asset management and sales growth.
Practical Uses & Real-World Applications of the Asset to Sales Ratio Calculator
Retail Sector: Comparing Competitor Efficiency
A retail analyst compares two supermarkets:
- Supermarket X: Assets = $4,000,000, Sales = $5,500,000 (Ratio: 0.73)
- Supermarket Y: Assets = $5,000,000, Sales = $6,000,000 (Ratio: 0.83)
Supermarket X shows more asset turnover relative to sales, indicating better efficiency.
Manufacturing Firm: Tracking Efficiency Improvement Over Time
A manufacturing company examines three years of data:
- Year 1: Assets = $8,000,000, Sales = $10,000,000 (Ratio: 0.80)
- Year 2: Assets = $9,000,000, Sales = $14,000,000 (Ratio: 0.64)
- Year 3: Assets = $11,000,000, Sales = $20,000,000 (Ratio: 0.55)
The decreasing ratio highlights improved efficiency in asset use over time.
Startup Growth Analysis
A venture capitalist tracks a startup’s growth:
- Year 1: Assets = $500,000, Sales = $250,000 (Ratio: 2.0)
- Year 2: Assets = $750,000, Sales = $900,000 (Ratio: 0.83)
- Year 3: Assets = $1,200,000, Sales = $1,800,000 (Ratio: 0.67)
The trend shows increasing efficiency as the startup matures and improves sales relative to asset base.
Frequently Asked Questions (FAQs) about the Asset to Sales Ratio Calculator
What is a good Asset to Sales Ratio?
There is no universal “good” ratio since it varies by industry type. Generally, a lower ratio means higher efficiency. Always compare your results against industry benchmarks and historical company data for meaningful insight.
How often should I calculate the Asset to Sales Ratio?
Calculating this ratio annually aligns with financial reporting cycles, but quarterly assessments can provide more immediate efficiency tracking.
Can the Asset to Sales Ratio be too low?
An extremely low ratio may suggest underinvestment in assets, which could risk future growth. Proper context is essential when interpreting very low ratios.
What is the difference between the Asset to Sales Ratio and Fixed Asset Turnover Ratio?
The Asset to Sales Ratio includes all company assets, while the Fixed Asset Turnover Ratio focuses only on tangible fixed assets like machinery and buildings, which is useful for capital-intensive industries.
Conclusion: Unlock Superior Business Insights with the Asset to Sales Ratio Calculator
The Asset to Sales Ratio Calculator is a vital resource for anyone involved in financial assessment, budgeting, or investment analysis. By quickly revealing how effectively assets are leveraged to generate sales, this tool empowers you to:
- Analyze operational efficiency with confidence and precision.
- Compare performance across competitors, sectors, and time periods.
- Detect trends and operational bottlenecks before they impact profitability.
- Make data-driven decisions that enhance resource allocation and growth.
- Benchmark financial health against industry standards to maintain competitiveness.
Leverage the power of this calculator regularly to gain deeper insights into asset utilization and optimize your company’s financial strategies. Remember, while powerful, this ratio works best when combined with other financial metrics and contextual analysis to provide a comprehensive picture of business health.
Start using the Asset to Sales Ratio Calculator to transform your financial evaluations and pave the way for smarter, more strategic decisions today.
Important Disclaimer
The calculations, results, and content provided by our tools are not guaranteed to be accurate, complete, or reliable. Users are responsible for verifying and interpreting the results. Our content and tools may contain errors, biases, or inconsistencies. We reserve the right to save inputs and outputs from our tools for the purposes of error debugging, bias identification, and performance improvement. External companies providing AI models used in our tools may also save and process data in accordance with their own policies. By using our tools, you consent to this data collection and processing. We reserve the right to limit the usage of our tools based on current usability factors. By using our tools, you acknowledge that you have read, understood, and agreed to this disclaimer. You accept the inherent risks and limitations associated with the use of our tools and services.
